Figures & data
Figure 1 Identification of key exosome-derived genes in HCC. (A) Modules with different traits determined via WGCNA. (B) Identification of genes in the exosome-specific module in HCC. (C) Determination of key exosome-derived genes in HCC. (D) Correlation between exosome-derived genes. (E) GO analysis of the exosome-derived genes. WGCNA, weighted gene co-Expression network analysis.
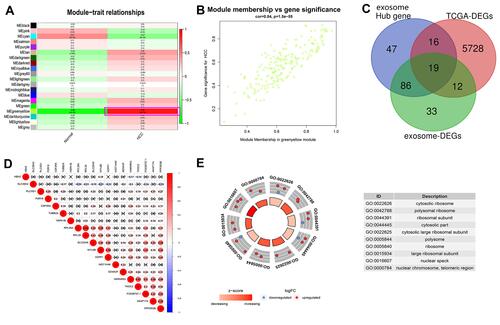
Figure 2 K-M curve analysis, risk score distribution and time-dependent ROC curve analysis of the prognostic model in the HCC cohorts from TCGA (A–C), ICGC (D–F) and GSE14520 (G–I). (A, D and G) Shorter survival times were presented in the high-risk group than in the low-risk group (P<0.01). (B, E and H) Distribution of prognostic risk scores based on the expression levels of the exosome-derived genes. (C, F and I) Time-dependent ROC curves of the prognostic model.
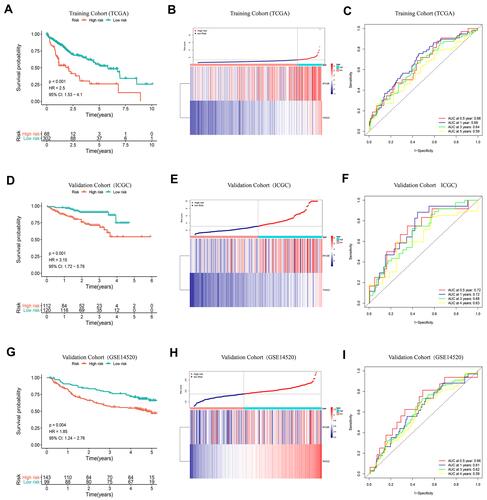
Figure 3 Response of high-risk patients and low-risk patients to chemotherapy. (A–L) Sensitivity of high-risk patients and low-risk patients to traditional chemotherapy drugs and molecular targeted drugs. (M) Top5 signaling pathways positively regulated by the exosome-derived prognostic signature. (N) Top5 signaling pathways negatively regulated by the exosome-derived prognostic signature.
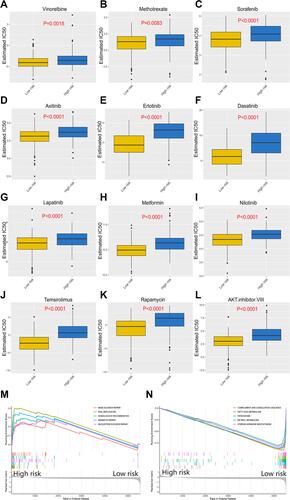
Figure 4 Correlation of immune cell infiltration and immune checkpoint expression with the prognostic risk in HCC patients. (A) The infiltration of immune cells in HCC patients and the corresponding prognostic risk score and survival status. (B–E) Differences in the infiltration of memory B cells (B), M0 macrophages (C), follicular helper T cells (D) and resting NK cells (E) in the high- and low-risk HCC patient groups. (P<0.05) (Wilcoxon test). (F) Interaction between prognostic risk and immune checkpoints including PDL1, PD1, CTLA4, B7H3 and TIM3. (G–K) The expression levels of PD1 (G), B7H3 (H), B7H5 (I), CTLA4 (J) and TIM3 (K) in the high-risk group were higher than those in the low-risk group. (P<0.05) (Wilcoxon test).
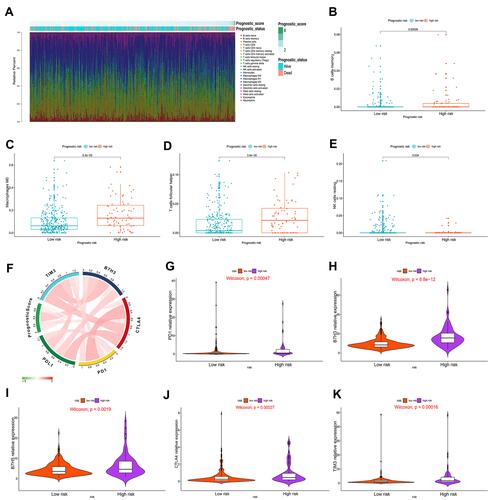
Figure 5 Construction and validation of a nomogram. (A) The independence of the prognostic model and clinical variables for prognosis prediction. (B) A nomogram was constructed to predict 1, 3, and 5 years of OS in HCC patients. (C–E) Calibration curves of the nomogram. (F–H) ROC curves validating the prediction specificity of the nomogram. (I–K) DCA indicated that the nomogram achieved the optimal clinical benefit. OS, overall survival. ROC curve, receiver operating characteristic curve.
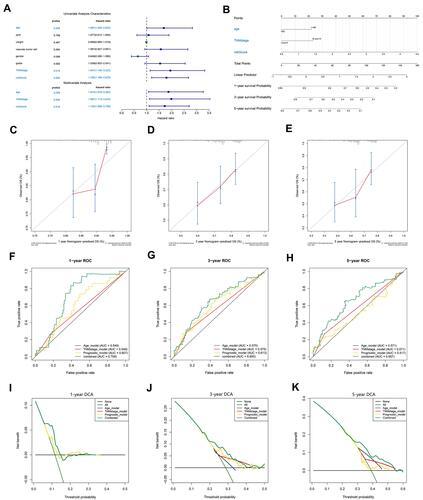
Figure 6 K-M curve analysis, risk score distribution and time-dependent ROC curve analysis of the recurrence model in the HCC cohorts from TCGA (A–C) and GSE14520 (D–F). (A and D) The high-risk group was more likely to experience recurrence than the low-risk group (P<0.05). (B and E) Expression of MYL6B and THOC2 and the corresponding prognostic risk scores of patients. (C and F) ROC curves validating the predictive value of the recurrence model.
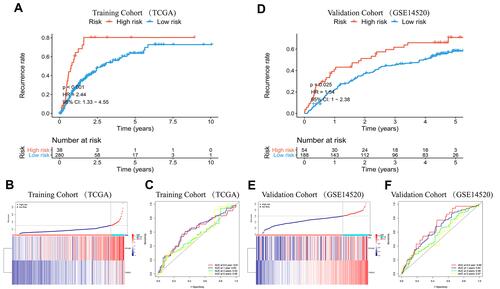
Figure 7 Establishment and evaluation of a nomogram. (A) Independent analysis of the recurrence model compared to clinical characteristics. (B) A nomogram was constructed to quantitatively assess the probability of recurrence. (C–E) Calibration curves of the nomogram. (F–H) ROC curves determined that the prediction performance of the nomogram was better than that of a single independent predictor. (I–K) DCA determined that the prediction of the nomogram could achieve the maximum clinical benefit.
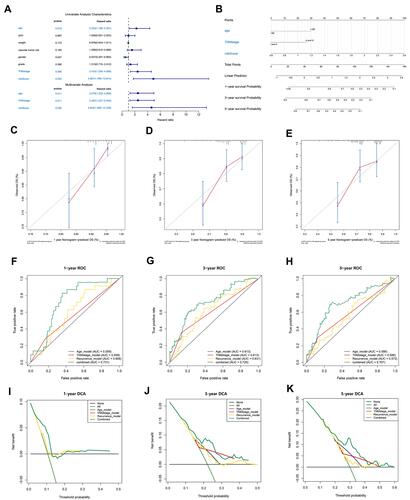
Figure 8 Diagnostic models constructed to distinguish HCC patients from normal individuals (A–F) and HCC from dysplastic nodules (G–L). (A and D) Confusion matrix of binary results indicated that the diagnostic model accurately distinguished HCC patients and normal individuals. (B and E) The expression profiles of MYL6B and THOC2 in HCC patients and the consistency between the predicted disease status and actual disease status (C and F) ROC curves determined the superior predictive performance of the diagnostic model. (G and J) The diagnostic model distinguished HCC and dysplastic nodules with high specificity and sensitivity. (H and K) Expression characteristics of MYL6B and THOC2 in HCC patients, distribution of the predicted disease status and actual disease status. (I and L) ROC curves validated the predictive value of the diagnostic model.
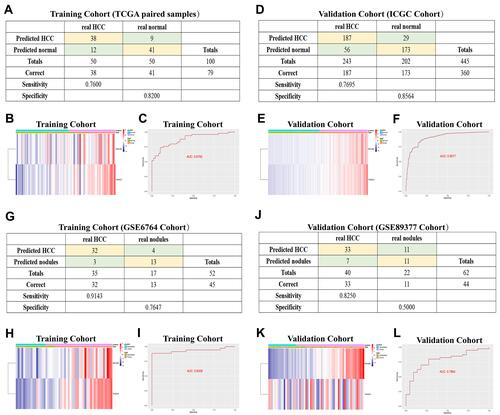
Figure 9 The expression characteristics of MYL6B and THOC2 and their correlation with patient prognosis, recurrence, and immune infiltration. (A, B) MYL6B (A) and THOC2 (B) expression was higher in the HCC tissues than in the paired normal tissues in TCGA. (P<0.05) (Wilcoxon test). (C, D) Higher expression of MYL6B (C) and THOC2 (D) was found in HCC tissues than in dysplastic nodules in GSE6764. (P<0.05) (Wilcoxon test). (E, F) Survival analysis of MYL6B (E) and THOC2 (F). (G, H) ROC curves validating the prognostic value of MYL6B (G) and THOC2 (H). (I–L) Shorter survival times (I and J) and progression-free survival times (K and L) were found in patients with high expression of MYL6B and THOC2 than in patients with low expression of MYL6B and THOC2 in the Kaplan-Meier Plotter database. (M, N) Correlation between the expression of MYL6B (M) and THOC2 (N) and immune infiltration.
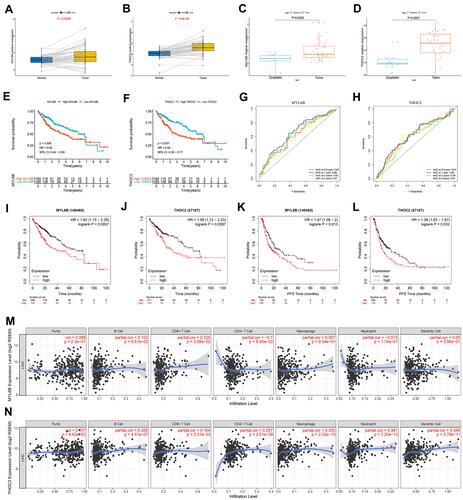
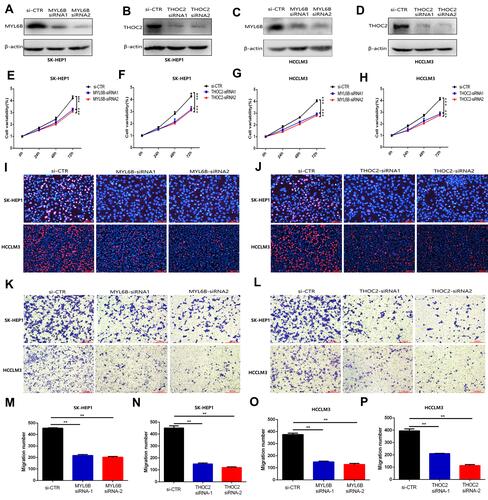
Figure 10 MYL6B and THOC2 suppress the proliferation and migration of HCC cells. (A–D) Western blot analysis confirmed that the expression of MYL6B and THOC2 was inhibited in the HCC cell lines with transfection of MYL6B and THOC2 siRNA. (E–H) CCK8 assay showed that MYL6B and THOC2 inhibition significantly inhibited the proliferation of HCC cell lines. ***p < 0.001(Student’s t-test). (I and J) The inhibitory effect of MYL6B and THOC2 inhibition on the proliferation of HCC cell lines was also validated in EdU assay. (K and L) The migration of SK-HEP1 cells and LM3 cells was significantly inhibited under the inhibition of MYL6B and THOC2. (M–P) Quantitative statistical results of the function of MYL6B and THOC2 inhibition on the migration of HCC cell lines. **p < 0.01(Student’s t-test).