Figures & data
Table 1 Study Inclusion and Exclusion Criteria
Figure 1 Study design (A) and inclusion and exclusion chart (B).
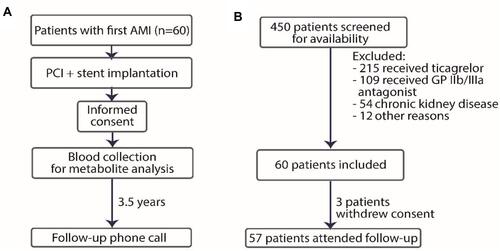
Table 2 Baseline Characteristics and Concentrations of Dimethylarginines and Nitric Oxide-Related Pathway Metabolites in Patients with AMI and Healthy Controls
Figure 2 Plasma concentration of endogenous metabolites from the arginine-related pathway from patients with acute myocardial infarction (AMI) compared to healthy controls. (A) Asymmetric dimethylarginine (ADMA), (B) Symmetric dimethylarginine (SDMA), (C) Citrulline (CIT).
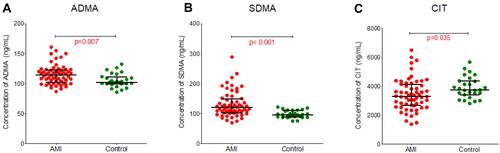
Table 3 Comparison of Baseline Characteristics Between Patients Who Experienced MACE and Those Who Did Not During the Median Follow-Up of 3.5 Years
Figure 3 (A) Concentrations of endogenous arginine-related pathway metabolites in patients after acute myocardial infarction (AMI) who developed major adverse cardiovascular events (MACE), compared to those who did not during the median follow-up of 3.5 years. (B) ROC curve showing the predictive value of symmetric dimethylarginine (SDMA) for the MACE curve.
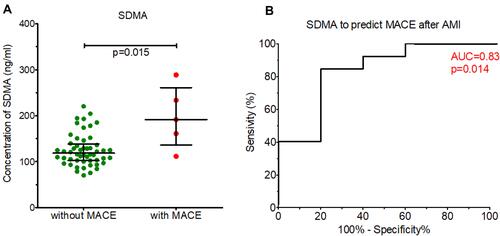
Table 4 Statistical Estimate for Prediction of Major Adverse Cardiovascular Events by Symmetric Dimethylarginine (SDMA)
Table 5 Multivariate Logistic Regression Model for Prediction of Major Adverse Cardiovascular Events by Symmetric Dimethylarginine Along with Clinical Variables
Figure 4 Kaplan–Meier analysis of event-free survival for MACE in patients after AMI stratified according to the plasma SDMA concentrations during the median 3.5-year follow-up.
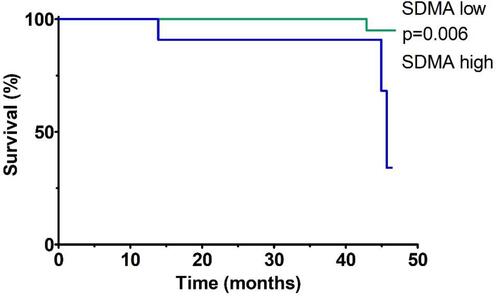
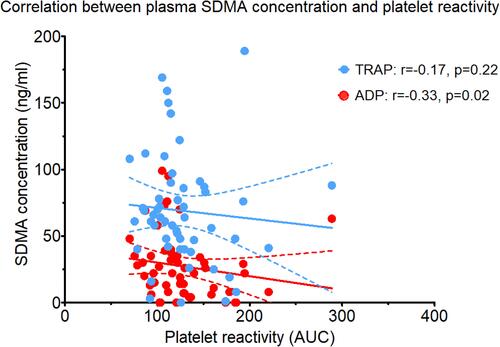
Figure 5 Correlation between plasma symmetric dimethylarginine (SDMA) concentrations and platelet reactivity assessed using adenosine diphosphate test (ADP) and thrombin receptor-activating peptide-6 test (TRAP).