Figures & data
Figure 1 Selection of patients included in the analysis.
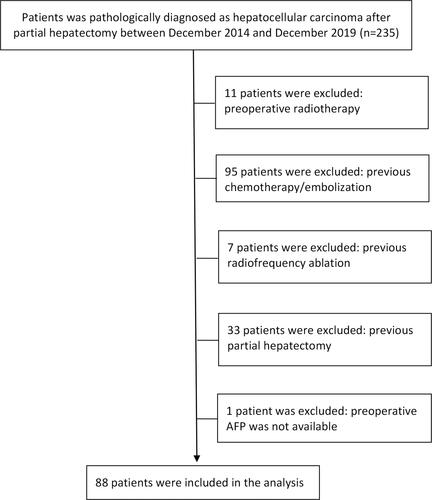
Table 1 Clinicopathological Features of HCC Patients
Table 2 Optimal Cutoff Values for Preoperative and Postoperative Inflammation Indicators
Figure 2 Kaplan‑Meier survival curves of DFS based on preoperative inflammatory indicators. (A) preNLR, (B) predNLR, (C) preLMR, (D) prePLR, (E) prePNI.
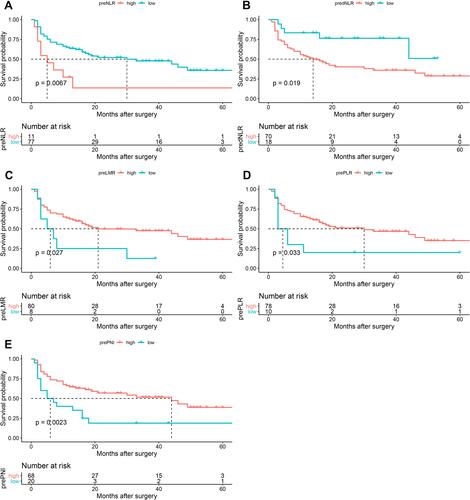
Figure 3 Kaplan‑Meier survival curves of DFS based on postoperative inflammation indicators. (A) postNLR, (B) postdNLR, (C) postLMR, (D) postPLR, (E) postPNI.
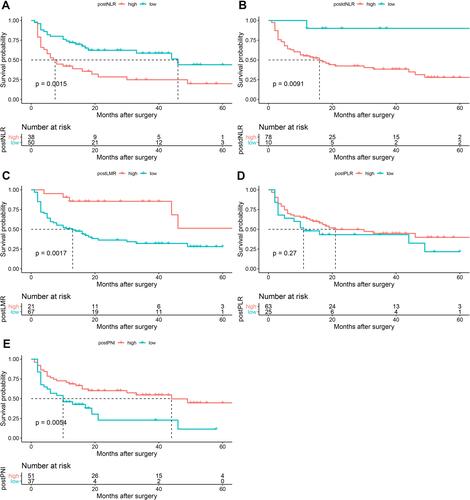
Table 3 Univariate and Multivariate Analysis of DFS
Table 4 Multivariate Analysis of Preoperative and Postoperative Models
Figure 4 Nomogram of the preoperative model.
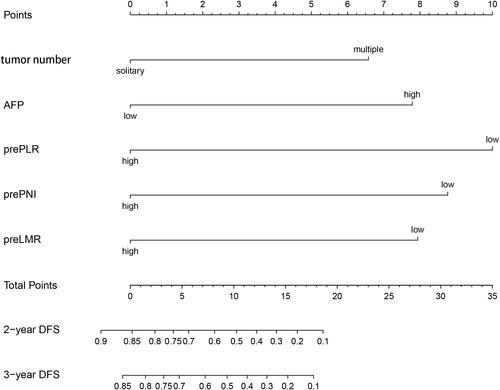
Figure 5 Calibration curve of the preoperative model for (A) 2 years and (B) 3 years.
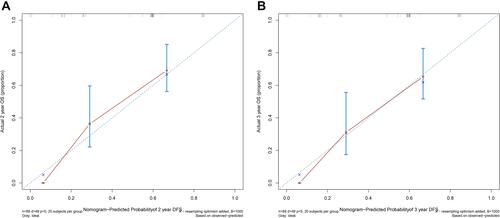
Figure 6 Nomogram of the postoperative model.
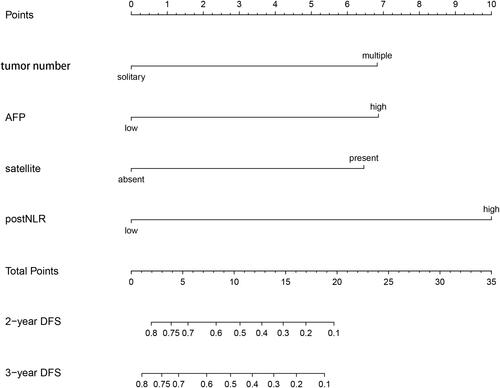
Figure 7 Calibration curve of the postoperative model for (A) 2 years and (B) 3 years.
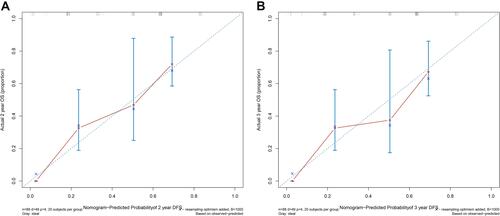
Figure 8 Nomogram of the combined model.
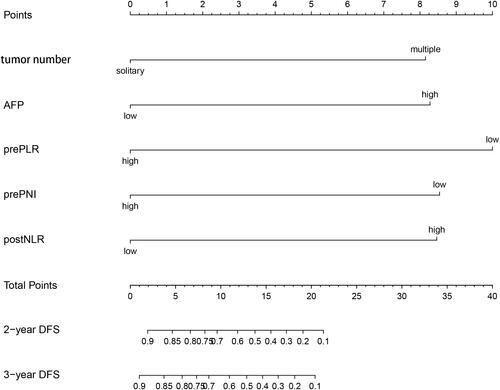
Figure 9 Calibration curve of the combined model for (A) 2 years and (B) 3 years.
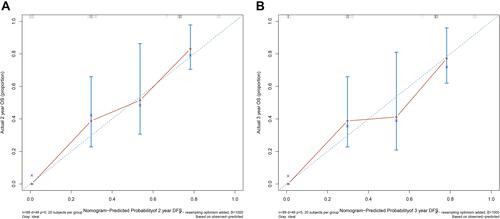
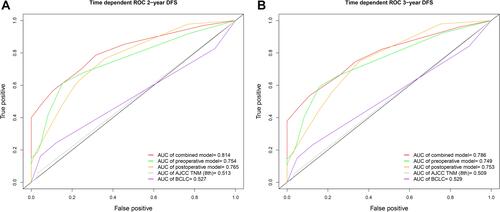
Figure 10 Different independent prognostic factors of the combined model and the area under the time-dependent ROC for predicting (A) 2-year and (B) 3-year DFS.
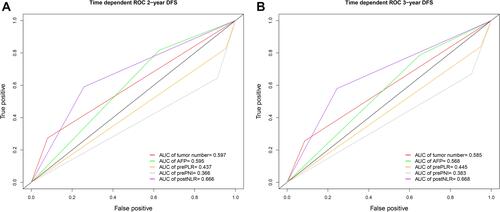
Figure 11 Different models and the area under the time-dependent ROC for predicting (A) 2-year and (B) 3-year DFS.