Figures & data
Table 1 The Timeline and the Number of Blood Samples Collected in Each Study Panel
Table 2 Participants’ Characteristics
Figure 1 The association between inflammatory biomarkers. This is an association matrix between each two inflammatory biomarkers. The association was analyzed using the mixed-effect model taking repeated measurements into consideration. All biomarkers were rank-normal transformed. The color and color intensity shows the direction (red: positive, blue: negative) and effect size, respectively. The star marks represent the false discovery rate (FDR) adjusted statistical significance (*FDR P-value < 0.1; **FDR p-value < 0.05).
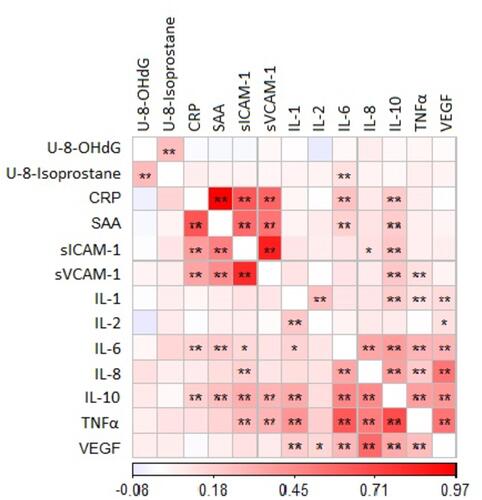
Table 3 The Metabolite-Inflammatory Biomarker Associations at a Significance Level of p-value <0.05 (False Discover Rate Adjusted)*
Table 4 The Number of Metabolite-Inflammatory Biomarker Associations by Super Pathway and Sub Pathway
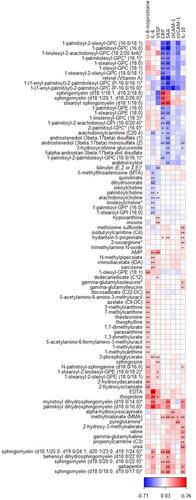
Figure 2 The hierarchical clustered feature-expression heat map of metabolite-inflammatory biomarker associations. Figure 2 is a feature‐expression heat map depicting the longitudinal association between plasma metabolite concentration and plasma/urine inflammatory biomarker concentration. Statistical analysis was performed using the linear mixed-effect regression model. In the visualization, the color and color intensity shows the direction (red: positive, blue: negative) and effect size, respectively. The star marks represent the false discovery rate (FDR) adjusted statistical significance (*FDR P-value < 0.1; **FDR p-value < 0.05).