Figures & data
Figure 1 The study overview of this research. In this study, both human and mice were involved. To evaluate MANF level in different age groups of human and mice, 64 healthy individuals involved and 24 mice were used. To observe the relationship of MANF with POD onset, 117 patients were initially involved. To evaluate the effect of MANF on surgery-induced POD-like behavior changes in mice, 33 mice were used.
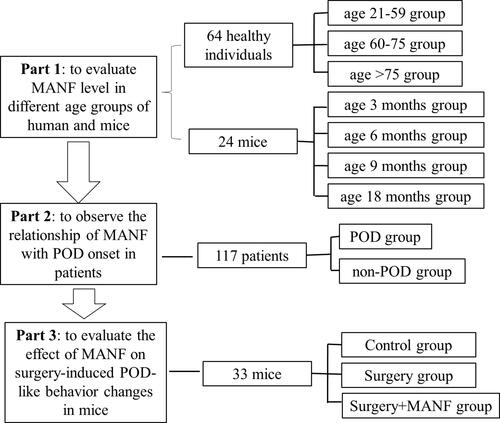
Table 1 Baseline Characteristics of These Patients Undergo Elective Knee Arthroplasty and Involved for MANF Detection
Figure 2 MANF decreased in an age-dependent manner in circulation and cortex. (A)The protein levels of MANF in human serum from healthy individuals in different age groups were measured by ELISA. (B)The endogenous protein levels of MANF in cortex of mice from different age groups were determined by Western blot analysis. Data are presented as the mean±SEM, n=6 per group for mice.
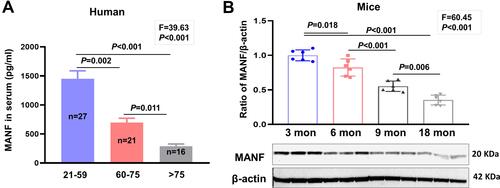
Figure 3 Relative lower baseline and less surgery-induced increase of endogenous MANF in POD patients than those in non-POD patients. ELISA kits were used to detect the pre-operative protein level of (A) MANF, (B) TNF-α, (C) IL-1β and (D) IL-6, in serum. Data are presented as the mean±SEM, Post-operative protein levels of MANF, TNF-α, IL-1β, and IL-6 in serum were detected to calculate the variations of these indicators after surgery (E–H).
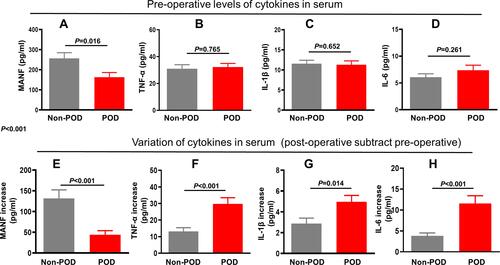
Figure 4 Endogenous MANF was up-regulated in mice brain 24 hours after surgery. (A) The protein levels of MANF in pre-cortex of mice from control group and surgery group.(B) The quantitative data of panel A. Data are presented as the mean ±SEM, n=6 per group.
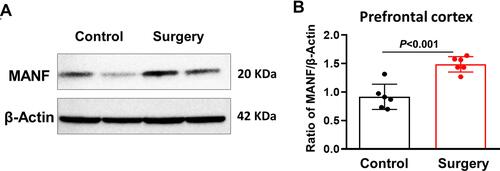
Figure 5 Recombinant human MANF protein reversed postoperative delirium-like behavior changes in mice. Multiple behavioral tests were performed to evaluated POD-like behavior changes in mice (A). The natural behaviors were assessed using buried food test (BFT) (B) and open field test (OFT) (C–E).The learned behaviors were assessed using Y maze test (OFT) (F and G). Data are presented as the mean±SEM, n=11 per group.
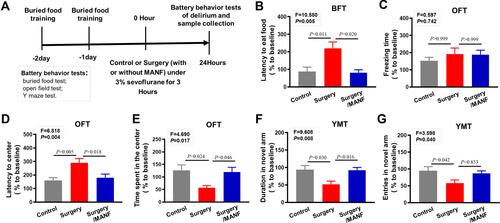
Figure 6 Recombinant human MANF protein inhibited surgery induced inflammatory response in mice. Levels of (A) TNF-α, (B) IL-6, and (C) IL-1β in serum were detected by ELISA assay. Protein levels of (D) TNF-α, (E) IL-6, and (F) IL-1β in pre-cortex of mice were measured using ELISA kits. Data are presented as the mean ±SEM, n=6 per group.
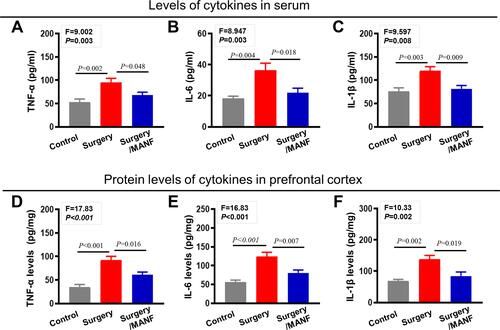
Figure 7 Recombinant human MANF inhibited surgery induced microglial activation and M1 polarization. (A and B) Activated microglia cells in cortex of mice with or without surgery were detected by immunohistochemistry assay with specific antibodies of Iba-1 and the number of Iba-1 positive cells were calculated and compared between the three groups. (C and D) The brain tissues from control and surgery treated mice were performed by immunohistochemistry of iNOS and iNOS+ cells were calculated. Data are presented as the mean ±SEM, n=6 per group.
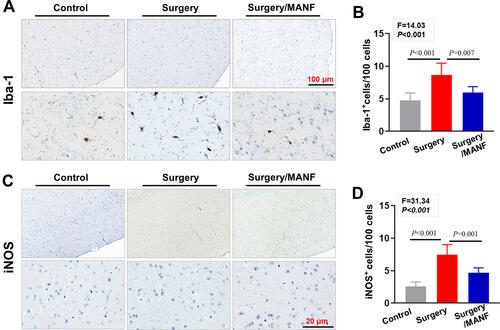
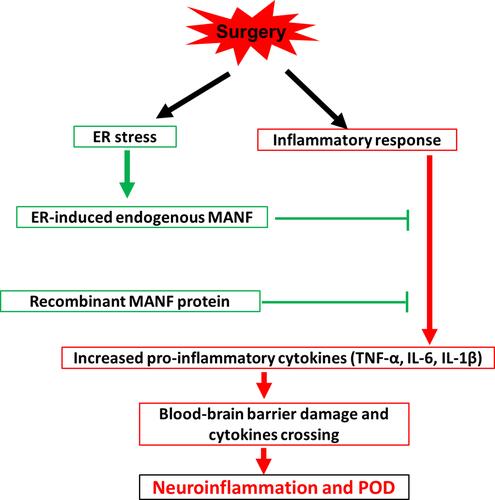
Figure 8 A summary of low level of MANF contributing to POD onset in the elderly.