Figures & data
Table 1 Demographic and Clinical Characteristics of Study Population
Table 2 ROC Curves in Assessing the Statue of Sepsis from the 1st Day to 7th Day
Figure 1 The mean plasma tissue kallikrein (TK) levels in controls and septic patients. TK levels in controls (76 controls and 42 SIRS patients) and septic patients who were admitted to ICU (62 septic patients and 88 patients with septic shock) on the day of diagnosis (Day 1), 3 days after diagnosis (Day 3), and 7 days after diagnosis (Day 7) are displayed. Data were presented as mean ± standard deviation of the mean (SD). One-way analysis of variance was used to indicate statistical difference. ****P<0.0001.
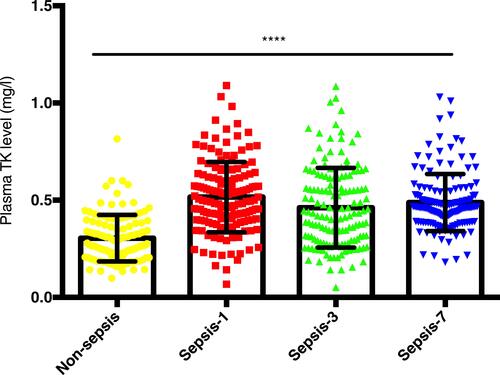
Figure 2 Diagnostic significance of TK on sepsis. ROC curves were plotted and pairwise comparisons were made among TK, CRP, WBC, PCT, IL6, and combination of TK and PCT for assessment of sepsis on the day of diagnosis (A–C), 3 days after diagnosis (D–F), and 7 days after diagnosis (G–I). Area under the curve (AUC) is shown in (A and B), (D and E), and (G and H) groups.
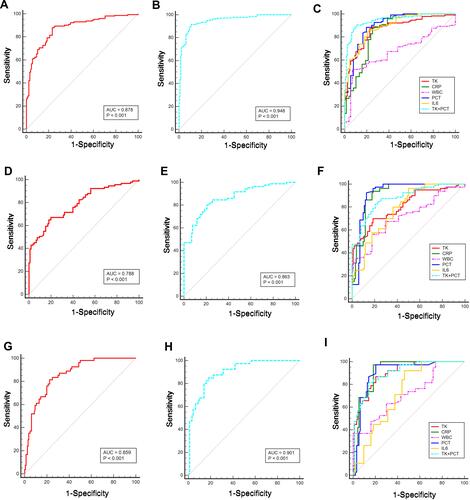
Table 3 Correlations Between TK Levels and General Variable in Septic Patients
Figure 3 Tissue kallikrein (TK) levels predicted the severity of sepsis. (A) Mean plasma TK levels in controls and patients with SIRS, sepsis, and septic shock. Data are expressed as mean ± standard deviation of the mean (SD). One-way analysis of variance was used to indicate statistical difference. ****P < 0.0001. (B) Correlation between TK levels and SOFA score. TK levels and SOFA score were highly correlative by bivariate correlation (R=0.311, P<0.001). (C) Correlation between TK levels and APACHE II score. TK levels and APACHE II score were highly correlative by bivariate correlation (R=0.311, P<0.001).
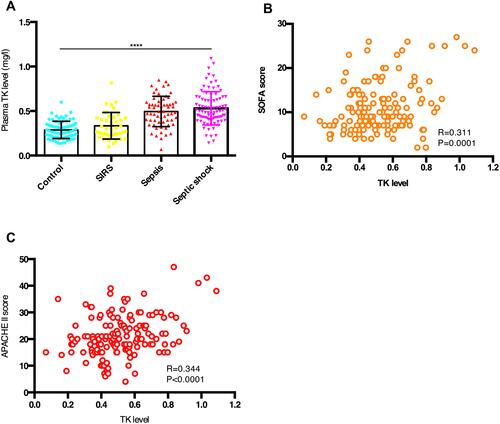
Figure 4 Kaplan–Meier survival curves based on plasma tissue kallikrein (TK) level. 1 = quartile 1; 2 = quartile 2; 3 = quartile 3; 4 = quartile 4. Compared with Quartile 1, Quartile 2 (24%, 26 days vs 8%, 27 days, Log rank test, p =0.079); Quartile 3 (33%, 24 days vs 8%, 27 days, Log rank test, p=0.008), and Quartile 4 (89%, 11 days vs 8%, 27 days, logrank test, p < 0.001) had higher risk of death and shorter event-free survival time.
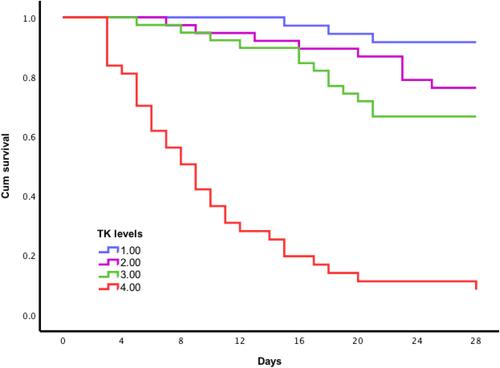
Figure 5 Tissue kallikrein (TK) exacerbated sepsis-induced endothelial hyperpermeability. TK treatment and Kallistatin treatment of HUVECs with LPS-induced sepsis model resulted in endothelial hyperpermeability (A) Real time electric cell–substrate impedance sensing (ECIS) measurements were conducted using normalized transcellular electrical resistance (TER) to record HUVECs permeability from 3 independent experiments. The lines denote the mean normalized resistance TERs ± standard deviation of the mean (SD). (B) Mean normalized TERs were measured from 3 independent experiments using ECIS. ****P < 0.0001 versus control; #### P < 0.0001 versus sepsis by two-tailed t-test. (C–F) Protein expressions of TK, ZO-1, and VE-cadherin were analyzed by Western blotting. Representative immunoblots were presented in the bar charts. The quantified OD of bands was corrected for the corresponding GAPDH. Data were presented as the mean ± standard deviation of the mean (SD). ****P < 0.0001 versus control; #P < 0.05 versus sepsis; ##P < 0.01 versus sepsis; ####P < 0.0001 versus sepsis by two-tailed t-test.
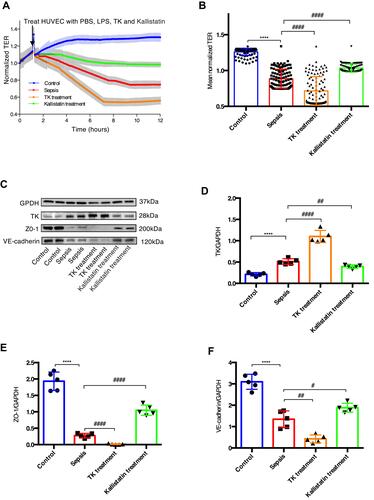
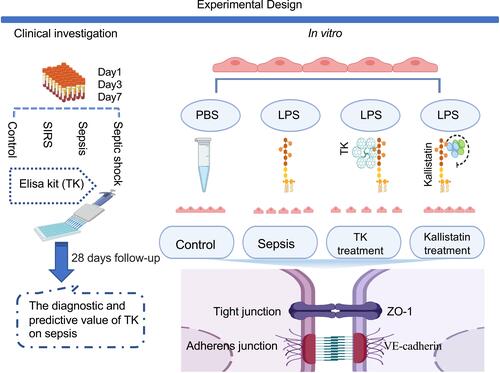
Figure 6 Experimental Design. Note: Created with BioRender.com.