111
Views
11
CrossRef citations to date
0
Altmetric
Original Research

Effects of Photobiomodulation Therapy Combined with Static Magnetic Field in Severe COVID-19 Patients Requiring Intubation: A Pragmatic Randomized Placebo-Controlled Trial

ORCID Icon, , , , , , , , , ORCID Icon & show all
Pages 3569-3585 | Published online: 24 Jul 2021

Figures & data

Figure 1 PBMT-sMF device. Figure 1 shows the device used to applied the PBMT-sMF and placebo. A cluster probe with 20 diodes containing 4 diodes of 905 nm, 8 diodes of 633 nm and 8 diodes of 850 nm was used: A - Red LEDs; B - Infrared LEDs; C - Super-pulsed laser; D - Magnetic field.

Figure 1 PBMT-sMF device. Figure 1 shows the device used to applied the PBMT-sMF and placebo. A cluster probe with 20 diodes containing 4 diodes of 905 nm, 8 diodes of 633 nm and 8 diodes of 850 nm was used: A - Red LEDs; B - Infrared LEDs; C - Super-pulsed laser; D - Magnetic field.

Figure 2 Irradiation of interventions. (A) shows the sites where PBMT-sMF and placebo were irradiated. The interventions were irradiated at six sites in the lower thorax/upper abdominal cavity and two sites in the neck area. (B) shows the full description of the parameters of PBMT-sMF applied in the treatment. This figure is owned by the authors.

Figure 2 Irradiation of interventions. (A) shows the sites where PBMT-sMF and placebo were irradiated. The interventions were irradiated at six sites in the lower thorax/upper abdominal cavity and two sites in the neck area. (B) shows the full description of the parameters of PBMT-sMF applied in the treatment. This figure is owned by the authors.

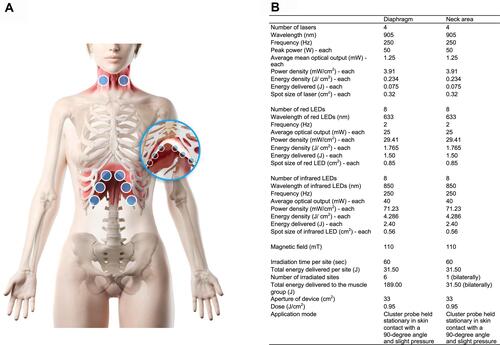
Table 1 Demographic and Clinical Characteristics of the Patients at Baseline

Figure 3 CONSORT flow diagram of the study. Figure 3 shows the flow diagram of the study including enrollment, randomization, intervention allocation, follow-up and data analysis of the two groups.

Figure 3 CONSORT flow diagram of the study. Figure 3 shows the flow diagram of the study including enrollment, randomization, intervention allocation, follow-up and data analysis of the two groups.

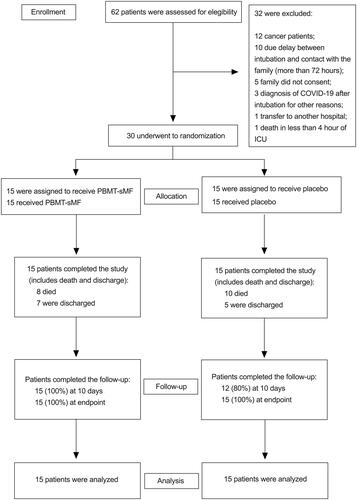
Table 2 Hospitalization Outcomes

Table 3 Ventilatory Parameters

Table 4 Biochemical Markers and Hemogram Parameters