Figures & data
Figure 1 Effects of MI-2 on the spinal MALT1 expression and phos-NF-κB (p65) activation in SCI/R rats. (A) Immunofluorescent staining of MALT1 in the anterior horn of rat’s spinal cord. Scale bar = 50μm. (B) Immunofluorescent density analysis to quantify the expression of MALT1. (C) Immunofluorescent staining of [phos-NF-κB (p65)]-positivities. Scale bar = 50μm. (D) Immunofluorescent density analysis to quantify the expression of phos-NF-κB (p65). Data are presented as the mean ± SEM. n = 6 per group. *P < 0.05 vs sham group, #P < 0.05 vs SCI/R group.
![Figure 1 Effects of MI-2 on the spinal MALT1 expression and phos-NF-κB (p65) activation in SCI/R rats. (A) Immunofluorescent staining of MALT1 in the anterior horn of rat’s spinal cord. Scale bar = 50μm. (B) Immunofluorescent density analysis to quantify the expression of MALT1. (C) Immunofluorescent staining of [phos-NF-κB (p65)]-positivities. Scale bar = 50μm. (D) Immunofluorescent density analysis to quantify the expression of phos-NF-κB (p65). Data are presented as the mean ± SEM. n = 6 per group. *P < 0.05 vs sham group, #P < 0.05 vs SCI/R group.](/cms/asset/b43e8e21-f374-422a-b47c-dd52db63ca4c/djir_a_12190353_f0001_c.jpg)
Figure 2 Localization of MALT1 and phos-NF-κB (p65) in different type of cells in the spinal cord of rats. (A) Double immunofluorescent staining showed colocalization of MALT1 or phos-NF-κB (p65) expression in astrocytes (GFAP positive cells) in the anterior horn of spinal cord. Scar bar = 20μm. (B, C) The quantified colocalization of MALT1 or phos-NF-κB (p65) with GFAP were assessed using the Pearson coefficient. (D) Double immunofluorescent staining to check colocalization of MALT1 or phos-NF-κB (p65) expression in microglia (Iba-1 positive cells) in the anterior horn of spinal cord. Scar bar = 20μm. (E, F) The quantified colocalization of MALT1 or phos-NF-κB (p65) with Iba-1 were assessed using the Pearson coefficient. (G) Double immunofluorescent staining showed MALT1 or phos-NF-κB (p65) expression in neurons (NeuN positive cells) in the anterior horn of spinal cord. Scar bar = 40μm. (H, I) The quantified colocalization of MALT1 or phos-NF-κB (p65) with NeuN were assessed using the Pearson coefficient. (J) Double immunofluorescent staining to colocalize MALT1 or phos-NF-κB (p65) with endothelial cells (CD31 positive cells) in the anterior horn of spinal cord. Scar bar = 20μm. (K, L) The quantified colocalization of MALT1 or phos-NF-κB (p65) with CD31 were assessed using the Pearson coefficient. Data are presented as the mean ± SEM. n = 6 per group. *P < 0.05 vs sham group, #P < 0.05 vs SCI/R group.
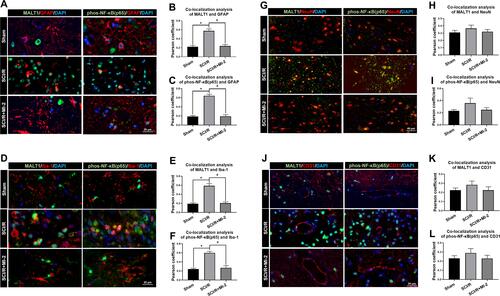
Figure 3 The expression and localization of ER stress marker protein Bip in spinal cord of rats. (A) Immunofluorescent staining of Bip in the anterior horn of rat’s spinal cord. Scale bar = 50μm. (B) Immunofluorescent density analysis quantifies the expression of Bip. Data are presented as the mean ± SEM. n = 6 per group. *P < 0.05 vs sham group, #P < 0.05 vs SCI/R group, &P < 0.05 vs SCI/R group.
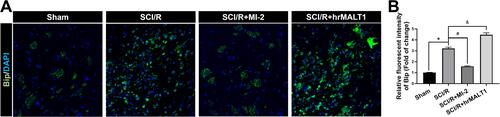
Figure 4 The colocalization of Bip with different cells in spinal cord. (A) Double immunofluorescent staining to check the colocalization of Bip with astrocytes (GFAP positive cells) in the anterior horn of spinal cord. Scar bar = 20μm. (B) Quantified colocalization of Bip with GFAP were assessed using the Pearson coefficient. (C) Double immunofluorescent staining showed colocalization of Bip with microglia (Iba-1 positive cells) in the anterior horn of spinal cord. Scar bar = 20μm. (D) Quantified colocalization of Bip with Iba-1 were assessed using the Pearson coefficient. (E) Double immunofluorescent staining showed colocalization of Bip with neuron (NeuN positive cells) in the spinal cord. Scar bar = 40μm. (F) Quantified colocalization of Bip with NeuN were assessed by using the Pearson coefficient. (G) Double immunofluorescent staining showed colocalization of Bip with endothelial cells (CD31 positive cells) in the spinal cord. Scar bar = 20μm. (H) Quantified colocalization of Bip with CD31 were assessed using the Pearson coefficient. Data are presented as the mean ± SEM. n = 6 per group. *P < 0.05 vs sham group, #P < 0.05 vs SCI/R group.
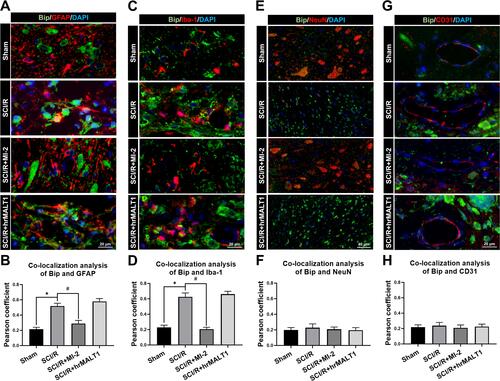
Figure 5 Transmission electron microscopy showed the morphology of endoplasmic reticulum of glial cells in the spinal cord. Yellow arrow indicates swallowed and dilated endoplasmic reticulum. n = 3. Scale bar = 1 μm.
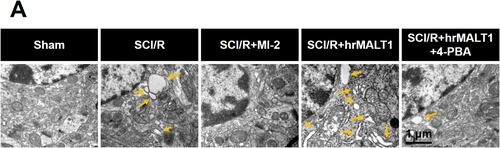
Figure 6 Evaluation of the blood-spinal cord barrier permeability. (A) Double immunofluorescent staining showed the MMP9 expression in astroglia of spinal cord. Scale bar = 20 μm. (B) Immunofluorescent density analysis quantifies the expression of MMP9. (C) Immunofluorescent staining of ZO-1 in the anterior horn of spinal cord in rats. Scale bar = 20μm. (D) Immunofluorescent density analysis quantifies the expression of ZO-1. (E) Evans Blue (EB) dye extravasation (red fluorescence) from the blood vessel in the spinal cord. (F) Immunofluorescent density analysis quantifies the extravasation of EB. n = 5 per group. (G) Representative graphs of blood-spinal cord barrier permeability identified by IgG-positive leakages (blue) outside of the endothelium. Scale bar = 10 µm. (H) Average size calculation based on IgG+ leakages and fold change in different groups. Data are presented as the mean ± SEM. n = 6 per group. *P < 0.05 vs sham group, #P < 0.05 vs SCI/R group, &P < 0.05 vs SCI/R group, ^P < 0.05 vs SCI/R + hrMALT1 group.
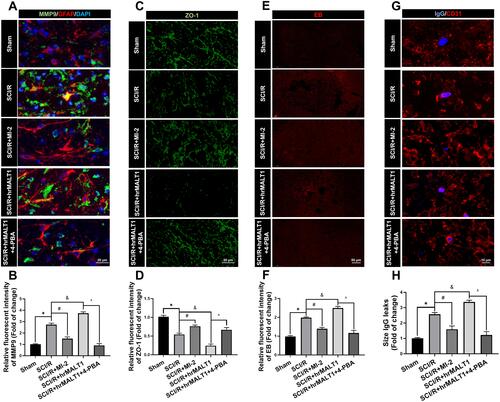
Figure 7 Spinal cord edema and water content evaluation. (A) Double immunofluorescent staining showed astroglial AQP4, a water channel protein, expression in spinal cord. Scale bar = 20 μm. (B) Immunofluorescent density analysis quantifies the expression of AQP4 in spinal cord. Data are presented as the mean ± SEM. n = 6 per group. (C) Water content of the spinal cord tissue was evaluated by calculating the percentage of water content via a wet-dry method with formula of (wet weight-dry weight)/wet weight × 100. n = 5 per group. Data are presented as the mean ± SEM. *P < 0.05 vs sham group, #P < 0.05 vs SCI/R group, &P < 0.05 vs SCI/R group, ^P < 0.05 vs SCI/R + hrMALT1 group.
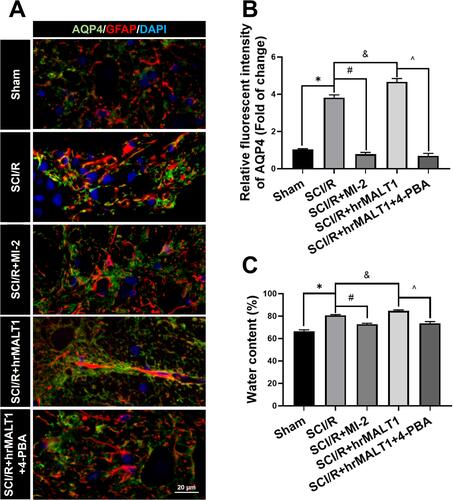
Figure 8 Evaluation of the neurovascular units in spinal cord. (A) The neurons, astrocytes and endothelial cells co-localization in spinal cord anterior horn were detected by triple immunofluorescent staining. Scale bar = 20 μm. (B, C) The number of NeuN and/or GFAP positivities was quantitatively analyzed. Data are presented as the mean ± SEM. n = 6 per group. *P < 0.05 vs sham group, #P < 0.05 vs SCI/R group, &P < 0.05 vs SCI/R group, ^P < 0.05 vs SCI/R + hrMALT1 group.
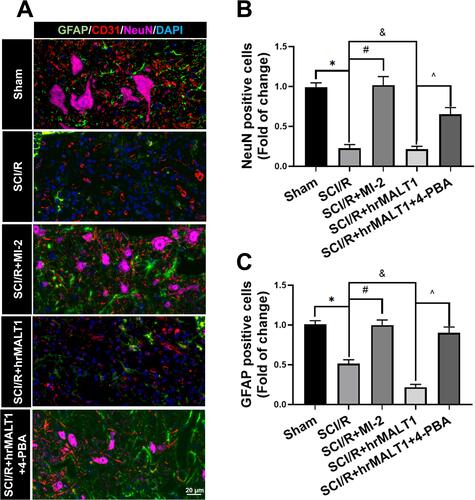
Figure 9 Neuroinflammation and oxidative stress profiles in the spinal cord of rats. (A) Double immunofluorescent staining detecting microglial M1 polarization (CD86 as M1 marker) in spinal cord. Scale bar = 20 μm. (B) Quantified percentage of CD86 positivities (M1 polarization). (C, D) Double immunofluorescent staining of inflammatory cytokines IL-1β in microglia and quantitative analysis of IL-1β fluorescent intensity to evaluate neuroinflammation. Scale bar=20 μm. (E) representative figures of DHE probe detecting superoxide anion in spinal cord and quantified immunofluorescent intensity values of DHE staining. (F). Scale bar = 50 μm. Data are presented as the mean ± SEM. n = 6 per group. *P < 0.05 vs sham group, #P < 0.05 vs SCI/R group, &P < 0.05 vs SCI/R group, ^P < 0.05 vs SCI/R + hrMALT1 group.
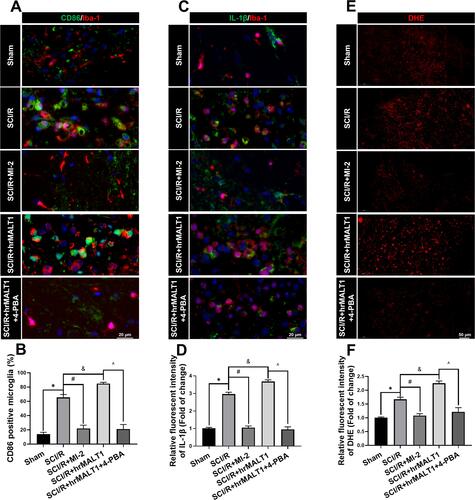
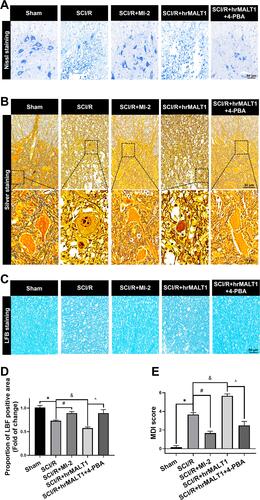
Figure 10 Neuronal loss and hindlimb locomotor function evaluation in rats. (A) Nissl staining and (B) silver staining were used to detect neuronal damage in the anterior horn of spinal cord. (C, D) LFB staining was used to detect demyelination of the spinal cord. (E) Neurological scores accessed by motor deficit index (MDI) scale. Data are presented as the mean ± SEM. n = 6 per group. *P < 0.05 vs sham group, #P < 0.05 vs SCI/R group, &P < 0.05 vs SCI/R group, ^P < 0.05 vs SCI/R + hrMALT1 group.