Figures & data
Table 1 The Clinical Characteristics of Enrolled Individuals
Figure 1 Expression of GSDMD, IL-1ß and IL-18 in patients with liver cirrhosis. (A-C) Representative IHC staining for GSDMD, IL-1ß and IL-18 in liver cirrhosis patients. Black scale bars, 100µm. (D) ELISA analysis of serum GSDMD levels in HC and liver cirrhosis patients. (E) ELISA analysis of serum IL-1ß levels in HC and liver cirrhosis patients. (F) ELISA analysis of serum IL-18 levels in HC and liver cirrhosis patients. (G) Correlation between serum IL-1ß and GSDMD in liver cirrhosis patients. (H) Correlation between serum IL-18 and GSDMD in liver cirrhosis patients. ***p<0.001.
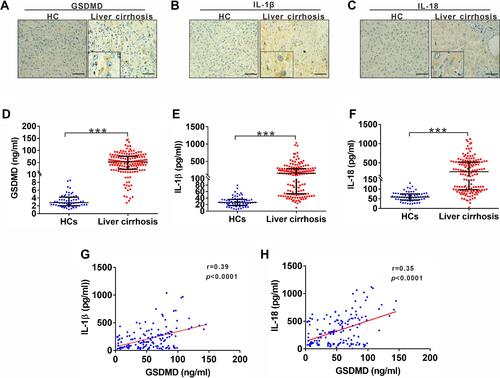
Figure 2 Serum levels of GSDMD, IL-1ß and IL-18 in patients with various etiologies. (A) ELISA analysis of serum GSDMD levels in liver cirrhosis patients with three main etiologies, including viral infection, alcohol consumption and autoimmunity. (B) ELISA analysis of serum IL-1ß levels in liver cirrhosis patients with three main etiologies, including viral infection, alcohol consumption and autoimmunity. (C) ELISA analysis of serum IL-18 levels in liver cirrhosis patients with three main etiologies, including viral infection, alcohol consumption and autoimmunity. Data represents the median (IQR). *p<0.05; ***p<0.001.
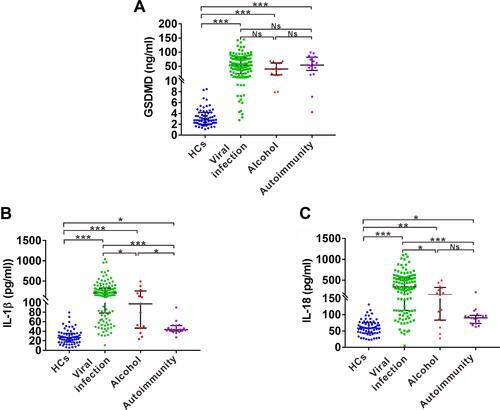
Table 2 Significant Factors Associated with GSDMD, IL-1ß and IL-18 by Step Forward Multiple Linear Regression Analysis in Liver Cirrhosis Patients
Figure 3 Correlation of serum GSDMD, IL-1ß and IL-18 levels with disease severity in cirrhosis patients. (A-C) ELISA analysis of serum levels of GSDMD (A), IL-1ß (B) and IL-18 (C) in liver cirrhosis patients with Child-Pugh classification A, B and C. (D-F) Correlation between serum GSDMD (D), IL-1ß (E) and IL-18 (F) with Child-Pugh score in liver cirrhosis patients. (G-I) Correlation between serum GSDMD (G), IL-1ß (H) and IL-18 (I) with APRI score in liver cirrhosis. (J-L) Distribution of GSDMD (J), IL-1ß (K) and IL-18 (L) in compensated and decompensated cirrhosis. *p<0.05; **p<0.01; ***p<0.001.
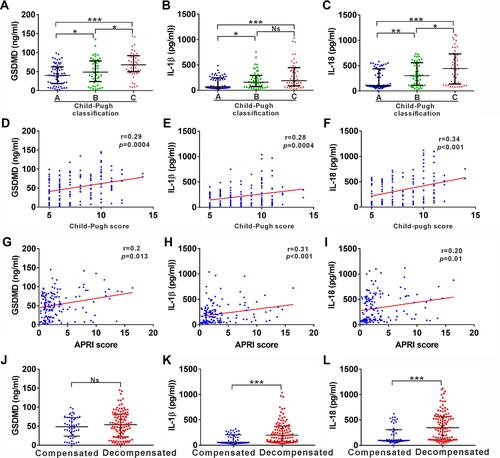
Table 3 Serum Levels of GSDMD, IL-1ß and IL-18 in Patients with Liver Cirrhosis with Complications
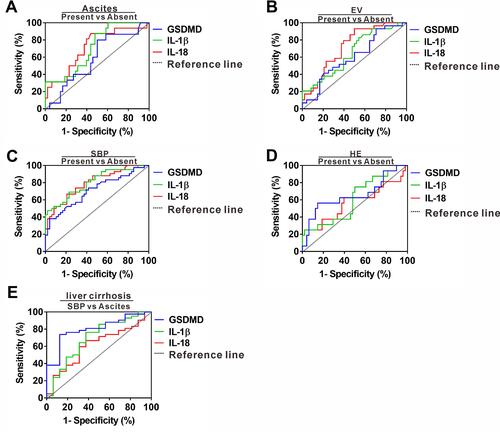
Figure 4 Differentiating power of serum GSDMD, IL-1ß and IL-18 for liver cirrhosis with various complications. (A) ROC curves of serum GSDMD, IL-1ß and IL-18 for predicting liver cirrhosis with ascites. (B) ROC curves of serum GSDMD, IL-1ß and IL-18 for predicting liver cirrhosis with EV. (C) ROC curves of serum GSDMD, IL-1ß and IL-18 for predicting liver cirrhosis with HE. (D) ROC curves of serum GSDMD, IL-1ß and IL-18 for predicting liver cirrhosis with SBP. (E) ROC curves of serum GSDMD, IL-1ß and IL-18 for predicting SBP occurrence in the setting of ascites for liver cirrhosis patient.