Figures & data
Table 1 Sequence of primers used for qRT-PCR amplification
Figure 1 Expression and prognostic value of seven glycolysis-related genes and IL1β and their relationship analyzed with bioinformatic database and RT-PCR. (A) Relative mRNA expression of glycolysis-related enzyme genes in human lung adenocarcinoma tumor and normal tissue (GEPIA) (*P<0.01); (B) Relative mRNA expression of glycolysis-related enzymes genes in human lung adenocarcinoma tumor and adjacent tissue. Samples of human lung adenocarcinoma and paracancerous tissue were collected and RNA extracted, then RT-PCR used to detect the expression of gene mRNA. A paired t-test was used. (*P<0.05; **P<0.01). (C) Correlation analysis of IL1β and glycolysis-related enzyme genes in lung adenocarcinoma tissue (GEPIA). (D) Analysis of the relationship between IL1β and glycolysis-related enzyme genes in lung adenocarcinoma tissue (TIMER).
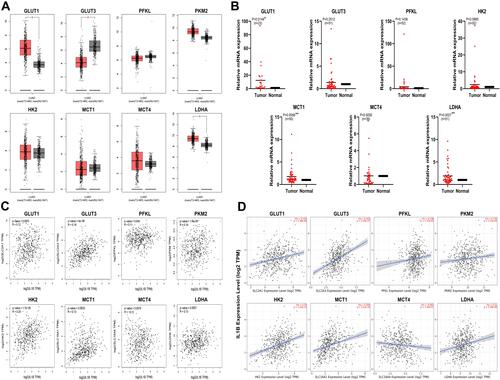
Figure 2 IL-1β promoted glucose consumption and lactate accumulation in A549 and LLC cell lines. (A) Cell-survival rates of A549 (left) and LLC (right) stimulated with different concentrations of IL-1β for 24 and 36 hours were analyzed with CCK8. A549 and LLC cells incubated with 20 ng/mL IL-1β for 36 hours reached the highest cell-survival rate. (B) A549 cells (upper) and LLC cells (below) treated with or without 20 ng/mL IL-1β for 36 hours. Compared with the control group, the IL-1β group showed lower levels of glucose and higher levels of lactate. (C) Western blot assay: expression level of GLUT1, GLUT3, PFKL, HK2, MCT1, MCT4 and LDHA in A549 (left) and LLC (right) treated with or without IL-1β. (D) Tests for cell migration and invasion ability under the impact of IL-1β. Wound-healing assay and transwell invasion in A549 cells (left); transwell migration and invasion analysis in LLC cells (right). *P<0.05, **P<0.01, ***P<0.001, ****P<0.0001.
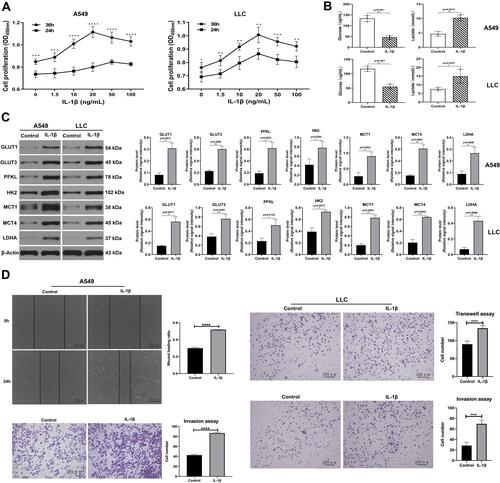
Figure 3 IL-1β promoted invasion and migration in A549 and LLC cell lines. (A) OD values of CCK8 assay stood for cell proliferation in IL-1β, IL-1β + 2DG, and control groups. (B) A549 cells and LLC cells incubated with IL-1β or IL-1β + 2DG. IL-1β + 2DG group received an obviously higher levels of glucose and lower levels of lactate than the IL-1β group. (C) Western blot assay showed expression levels of 7 glycolysis-related proteins when A549 (left) and LLC (right) were not only treated with IL-1β but also with 2DG. (D) Effect of IL-1β and IL-1β + 2DG on cell migration and invasion through wound-healing test (upper) and transwell invasion assay (below) respectively in A549 cells. (E) Transwell migration (upper) and invasion (lower) assays of LLC cells stimulated with only IL-1β (20 ng/mL, 36 hours) or with IL-1β + 2DG. *P<0.05, **P<0.01, ***P<0.001, ****P<0.0001.
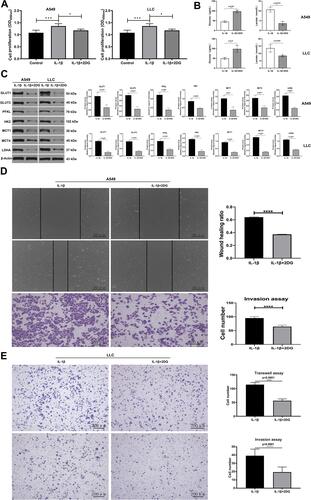
Figure 4 IL-1β upregulated glycolysis of LLC cells and promoted pulmonary metastasis in vivo. (A) Animal PET–CT images reflected that standardized uptake value (SUV) was obviously higher in the IL-1β group. (B) Histogram of naked tumor mass (upper) and volume (below) in control and IL-1β groups. (C) Lungs in H&E-stained histological observation, showing alveolar structure destruction and tumor-metastasis area. (D) Gross observation of subcutaneous tumors in control, IL-1β, and IL-1β + 2DG groups. Their weight (E, left) and volume (E, right) were recorded. *P<0.05, **P<0.01, ***P<0.001.
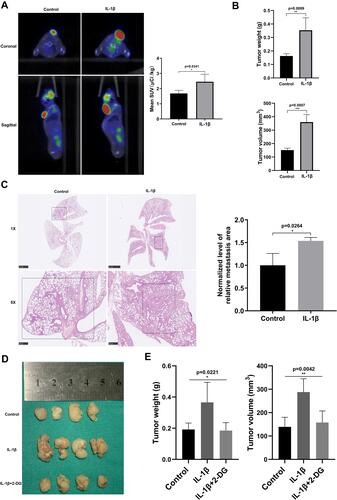
Figure 5 IL-1β upregulated glycolysis and further facilitated migration and invasion of A549 and LLC cells via the p38 pathway. (A) Western blot assay: distinct pathway proteins (STAT3, p38, ERK, JNK, and NFκB) in A549 and LLC cells cultured with IL-1β (20 ng/mL) previously. The p38 pathway was activated. (B) Upper: concentration of p38 inhibitor (30 µM) in A549 and LLC cells was confirmed to be viable through immunoblots. Below: glucose and lactate levels of LLC and A549 cells cultured with 30 µM p38-pathway inhibitor and then stimulated with IL-1β (20 ng/mL). Glucose levels increased and lactate levels decreased significantly in the IL1β + p38 inhibitor group. (C) Seven glycolysis-related proteins were attenuated during existence of p38 inhibitor on immunoblots. (D) Wound-healing test (upper) and transwell invasion (lower) assays of A549 cells incubated with IL-1β or IL-1β + p38 inhibitor for 24 hours. (E) Transwell migration (upper) and invasion (lower) assays of LLC cells cultured with or without p38 inhibitor and then stimulated with IL-1β. (F) Weight and volume of subcutaneous tumors when LLC cells were treated with p38 inhibitor in advance. *P<0.05, **P<0.01, ***P<0.001, ****P<0.0001.
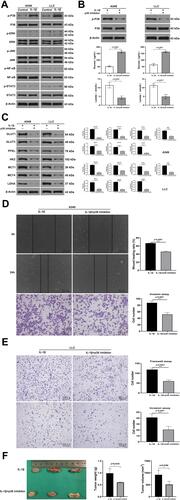
Table 2 Screening of small-molecule IL-1β inhibitors by molecule docking (top 20)
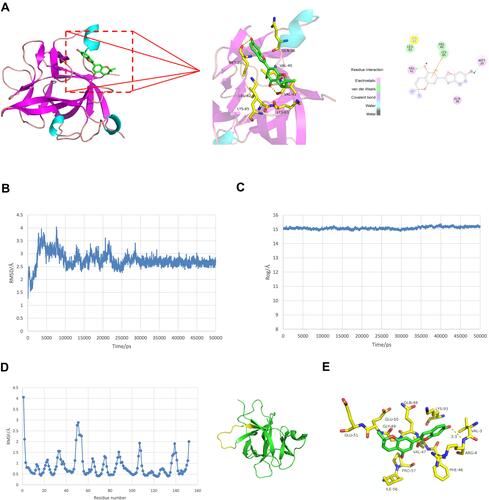
Figure 6 Molecular docking and molecular dynamic simulation study for ZINC14610053 on targeting IL-1β. (A) 3-D interactions of ZINC14610053 inside the active center of IL-1β (left panel); 2-D interactions of ZINC14610053 inside the binding pocket of IL-1β (right panel). (B) RMSD curve of conformation of ZINC14610053 and IL-1β. (C) Turning radius curve of conformation of ZINC14610053 and IL-1β. (D) RMSF curve of conformation of ZINC14610053 and IL-1β. (E) Interaction residues between ZINC14610053 and IL-1β after molecular dynamic optimization.