Figures & data
Figure 1 Effects of acute and repetitive SSDE exposure on lung cellular influx in vivo. (A) Total cell counts; (B) neutrophil; (C) eosinophil; (D) lymphocyte; and (E) macrophage recruitment in BALF following single and repetitive exposure to saline or SSDE based on differential cell counting. (F) Flow diagram of positive and negative (Neg) gating strategy to determine frequencies of CD11c+F4/80+ alveolar macs; SiglecF+ eos; Ly6G+ neutrophils; Ly6C+Ly6G- monocytes; CD4+ T cells. BALF population counts for alveolar macrophages (G); monocytes (H); neutrophils (I); CD4+ T cells (J); and eosinophils (K) following repetitive exposure to SSDE compared to saline controls. Error bars are standard error of mean (*p ≤ 0.05; **p ≤ 0.01; ***p ≤ 0.001; ****p ≤ 0.0001).
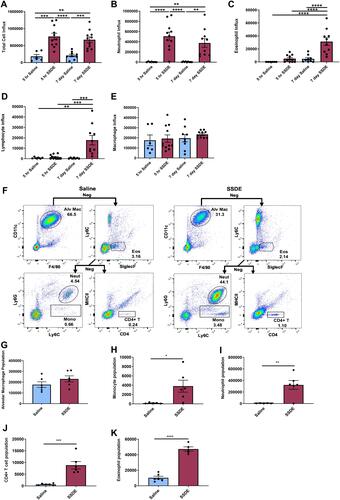
Figure 2 SSDE-induced alterations in inflammatory mediators and lung histopathology in vivo. (A–D) Cytokine release in BALF for (A) TNF-α; (B) IL-6; and (C) CXCL1 following single and repetitive exposure to SSDE. (D–G) Representative histology of lungs following single and repetitive exposure to saline and SSDE. (D) Single exposure, saline; (E) single exposure, SSDE; (F) 7-day exposure, saline; and (G) 7-day exposure, SSDE. Green arrow indicates perivascular inflammation. Yellow arrows indicate representative infiltrating granulocytes. Scale bar in D is 120 µm. Images taken at 20× with 150% optical zoom. (H–J) Representative images of lung immunofluorescence of LYVE-1 are shown. (H) Seven-day exposure, saline; (I) 7-day exposure, SSDE; (J) quantification of fluorescent intensity of LYVE-1 in saline- and SSDE-exposed mice. Quantification data are mean ± SEM, four lung sections were imaged per mouse, with five mice each in saline and control groups (total of 20 images per group). Error bars are standard error of mean (*p ≤ 0.05; **p ≤ 0.01; ***p ≤ 0.001; ****p ≤ 0.0001).
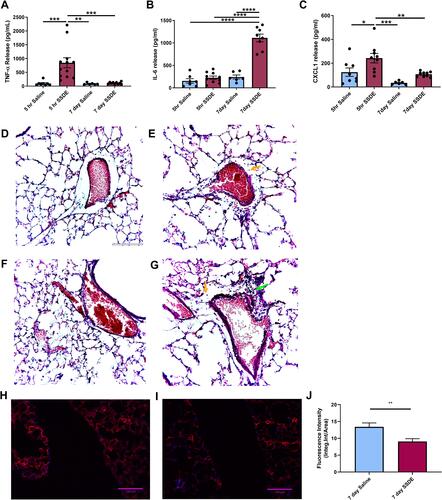
Figure 3 Effects of SSDE on bronchial epithelial cell inflammatory response following 5- and 24-hours treatments. Supernatant fractions from BEAS2-B treated with 1 or 5% SSDE were assayed at 5 or 24 hours post-treatment for IL-6 ((A), 24 hours; (C), 48 hours), IL-8 ((B), 24 hours; (D), 48 hours), and lactate dehydrogenase ((E), 24 hours; (F), 48 hours). Cells treated with 1 or 5% SSDE were also assessed for proliferative/metabolic activity via MTT assay at 24 (G) or 48 (H) hours. Error bars are standard error of mean (*p ≤ 0.05; ***p ≤ 0.001; ****p ≤ 0.0001).
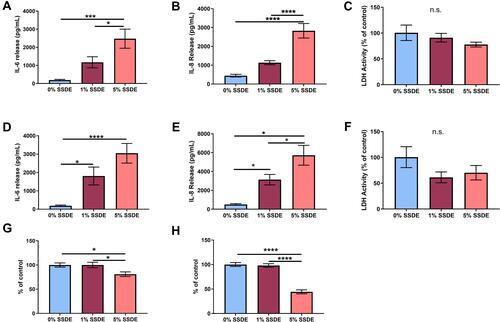
Figure 4 Pathways and transcripts altered after repetitive SSDE exposure in vivo. Pathway signature scores for (A) immune response; (B) chemokine activity; (C) cell-cell signaling; (D) calcium-mediated signaling; (E) calcium ion binding; and (F) activation of MAPK pathways. (G) Genes found to be significantly (P < 0.05) downregulated in SSDE- versus saline-instilled mice in a gene-by-gene analysis. (H) Top 20 significantly (P < 0.05) upregulated genes in SSDE- versus saline-instilled mice in a gene-by-gene analysis. N=6 mice per group. ****p < 0.0001.
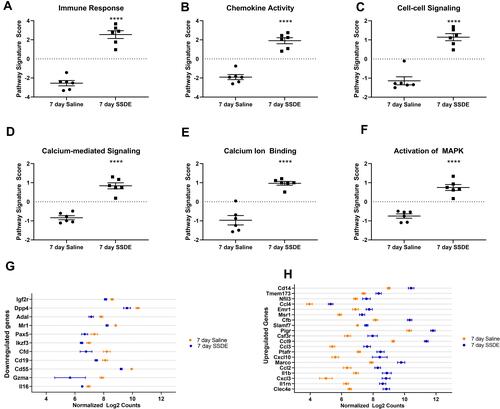
Figure 5 Effects of proteases on the SSDE inflammatory potential in bronchial epithelial cells. Gel zymography was performed on complete SSDE (A) or PDSSDE (B) to assess protease activity in the extracts. Solid rectangular boxes highlight main protease activity, evidenced by clearing (white banding) in gels. Dashed rectangular boxes identify gel lanes. BEAS-2B were treated with 1% and 5% SSDE or PDSSDE and IL-6 and IL-8 release were assessed at 5 hours following treatment (C and D) or 24 hours following treatment (E and F). BEAS-2B were pretreated for 1 hour with media control, PAR-1 antagonist SCH-79797 or PAR-2 antagonist FSLLRY-NH2 before being exposed to either medium control or SSDE for 24 hours. After 24 hours, supernatant was collected and IL-6 (G) and IL-8 (H) release were quantified. Error bars are standard error of mean (δ, p <0.05 compared to all other groups; β, p <0.05 versus control; λ, p <0.05 versus control, 1% PI, and 5% PI groups; ε, p <0.05 versus all groups except 5% PDSSDE; φ, p <0.05 versus all groups except 5% SSDE).
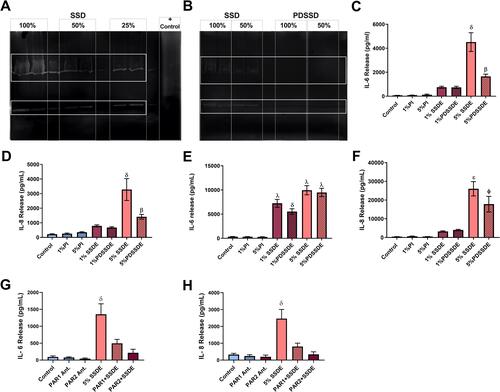
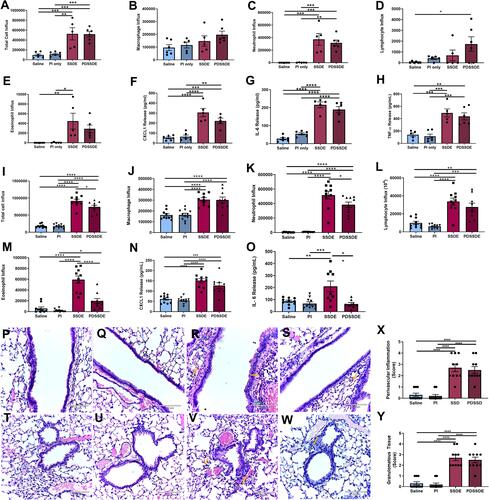
Figure 6 Effects of protease activity depletion on SSDE-induced lung immune response in vivo. (A–H) Cellular influx and inflammatory mediators in BALF at 5 hours following an acute SSDE or PDSSDE exposure. (A) Total cell counts; (B) macrophages; (C) neutrophils; (D) lymphocytes; (E) eosinophils; (F) CXCL1; (G) IL-6; (H) TNFα. (I–O) Cellular influx and inflammatory mediators in BALF following a 7-day repetitive exposure to SSDE or PDSSDE. (I) Total cell counts; (J) macrophages; (K) neutrophils; (L) lymphocytes; (M) eosinophils; (N) CXCL1; (O) IL-6. (P–W) Representative images of lung histopathology following 7 days of daily instillations to saline (P), saline treated with protease inhibitor (Q and U), SSDE (R and V), or PDSSDE (S and W). Large airways are represented in P-S; small airways represented in T-W. Green arrow indicates perivascular inflammation. Yellow arrows indicate representative infiltrating leukocytes. Blinded scoring for perivascular inflammation (X) and granulomatous/immune aggregate tissue (Y) were performed. Images were taken at 20x with 150% optical zoom, scale bar is 120 µm. Error bars are standard error of mean (*p ≤ 0.05; **p ≤ 0.01; ***p ≤ 0.001; ****p ≤ 0.0001).