Figures & data
Table 1 Comparison of Baseline Clinical Characteristics Between Survivors and Non-Survivors
Table 2 Comparison of Biomarkers Detected at the Second Timepoint (During Septic Shock or 5–7 Days After ICU Admission) Between Survivors and Non-Survivors
Table 3 Comparison of Biomarkers Detected at the Third Timepoint (During the Convalescence of Septic Shock or 1–3 Days Before Death) Between Survivors and Non-Survivors
Figure 1 Diagram of patient selection.
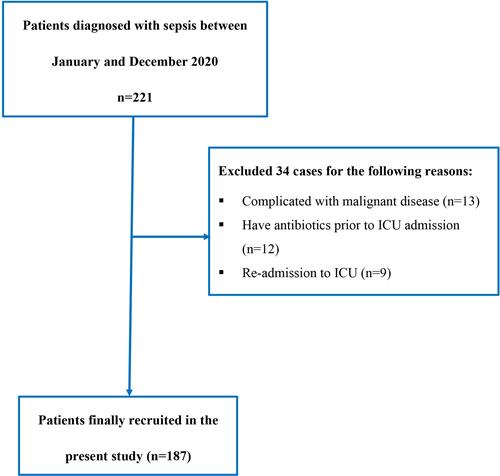
Table 4 Correlation Between Trx-1 and Other Biomarkers
Figure 2 Line plot presenting changes in the levels of different parameters at three different time points among survivors or non-survivors. The definition of different time points: 1, within 24 h of admission in ICU; 2, during septic shock (for patients who did not develop septic shock, the second timepoint was defined as 5–7 days after admission instead); 3, during the convalescence of septic shock (survival group) or 1–3 days before death caused by sepsis (non-survival group).
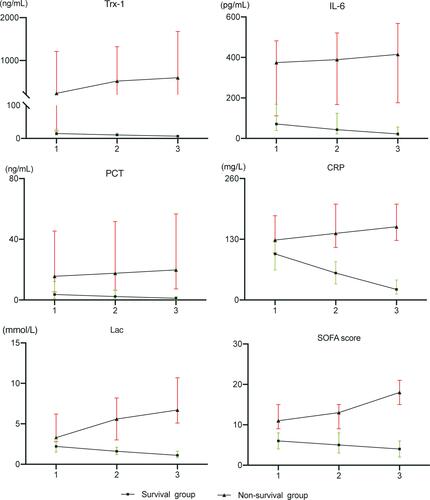
Table 5 Prognostic Significance of Parameters Detected at Baseline
Table 6 Parameters Available at the Second Timepoint with Independent Prognostic Value
Table 7 Parameters Available at the Third Timepoint with an Independent Prognostic Value
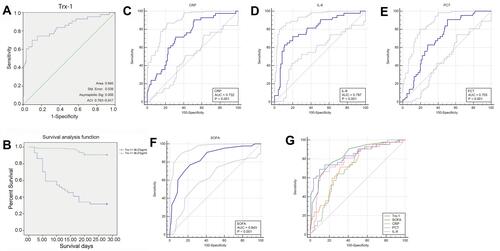
Table 8 Summary of ROC Analysis for Each Parameter
Table 9 Pairwise Comparison of ROC Curves Between Different Parameters
Figure 3 ROC analyses of different biomarkers. (A, C-F) ROC curve and corresponding parameters of TRx-1 (A), CRP (C), IL-6 (D), PCT (E), SOFA (F); (B) Kaplan-Meier survival curve of patients with Trx-1 level > 38.27 ng/mL (green line) and those with Trx-1 level < 38.27 ng/mL (blue line); (G) combined ROC curves of all biomarkers.