Figures & data

Figure 1 The distribution of expression of all samples before and after normalization.
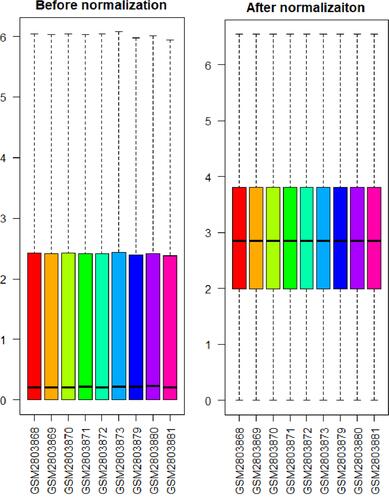
Figure 2 (A) The distribution of expression of samples involving principal component analysis (PCA) for confirming biological variability between different samples; (B) 112 DEGs are shown in the volcano plot, containing 44 upregulated genes in red and 68 downregulated genes in green; (C) the heatmap shows the 112 most significant DEGs. Red indicates relatively high expression, and blue indicates relatively low expression. DEGs were identified by the criteria of|log2fold change (FC)|> 2 and adj. p. val < 0.05.
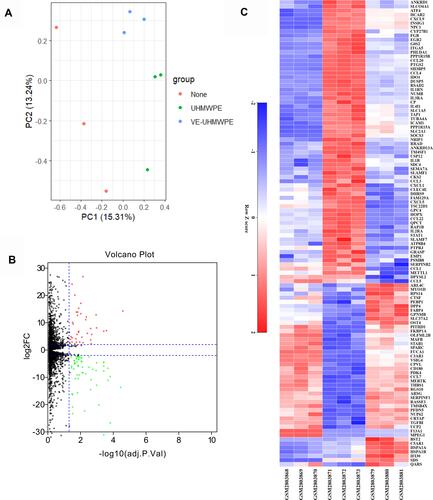
Table 1 Top 20 Biological Processes of DEGs
Figure 3 GO including biological process (A), cellular components (B) and molecular function (C) analysis, and KEGG (D) enrichment analysis of the DEGs between the VE-UHMWPE group and the UHMWPE group.
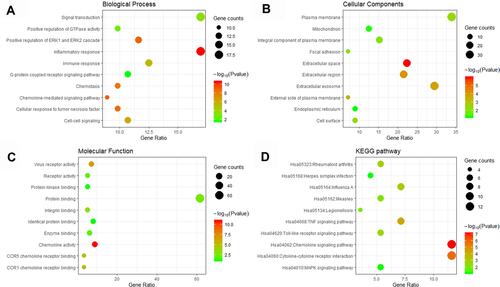
Figure 4 Protein–protein interaction (PPI) network analysis. (A) The PPI network of DEGs visualized in Cytoscape. Red indicates upregulated genes, and green indicates the downregulated genes. (B) Four significant modules in the PPI network.
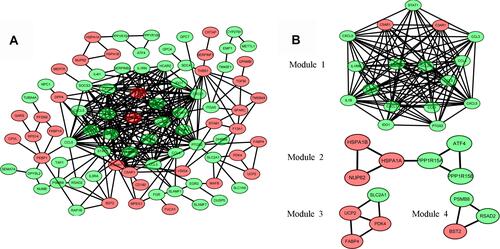
Figure 5 The biological process analysis of the top 20 DEGs was constructed using BiNGO. The color depth of nodes refers to the corrected p-value of ontologies. The size of nodes refers to the numbers of genes that are involved in the ontologies. P < 0.01 was considered statistically significant.
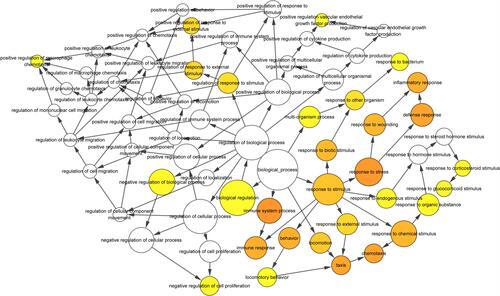
Table 2 List of the Top 10 Hub Genes Selected by MCC, MNC and Degree Methods in cytoHubba
Figure 6 Identification of the hub genes. (A) Hub genes were identified by the overlap of the three methods in CytoHubba; (B) the selected hub genes were all included in the most significant module.
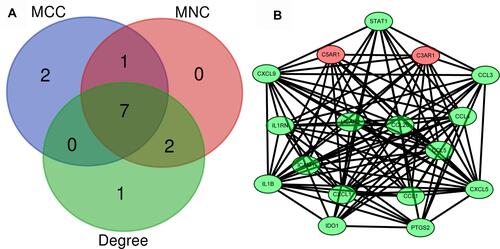
Figure 7 The network of TF-DEG was obtained from the ENCODE database.
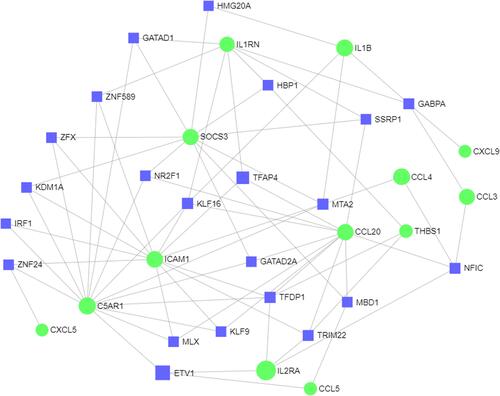
Figure 8 The network of DEG-miRNA was obtained from the tarbase, miRTarBase, and miRecords databases.
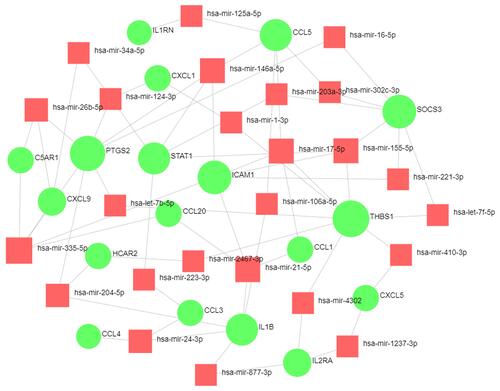
Table 3 Co-DEGs Regulated by TF and miRNAs
Figure 9 Integrative regulatory network of TF-DEG-miRNA.
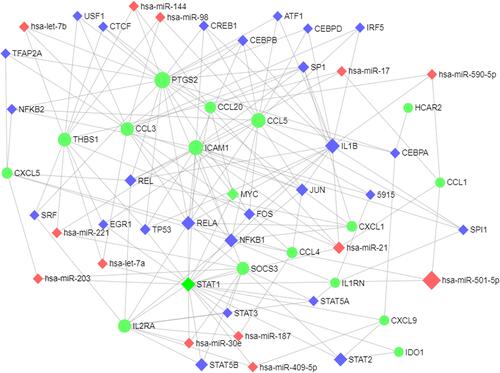
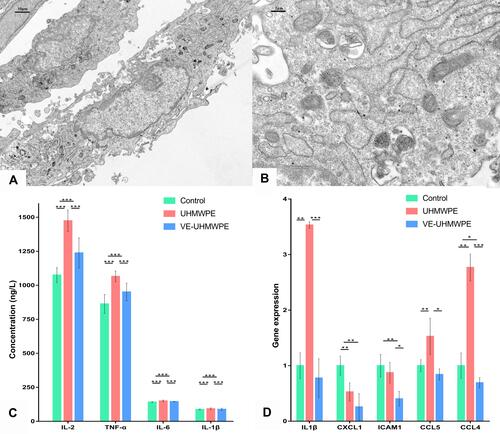
Figure 10 Macrophage intervention, qRT-PCR and ELISA. (A) Macrophage-engulfed VE-UHMWPE particles observed under a transmission electron microscope (3000× magnification); (B) macrophage-engulfed VE-UHMWPE particles observed under transmission electron microscope (15,000× magnification); (C) comparison of the top five hub genes with high connectivity degree by qRT-PCR and (D) comparison of inflammatory factors in supernatant by ELISA. *p-value < 0.05, **p-value < 0.01 and ***p-value < 0.001.