Figures & data
Table 1 Basic Characteristics of Study Subjects
Figure 1 Study participant analysis of suspected sepsis neonates.
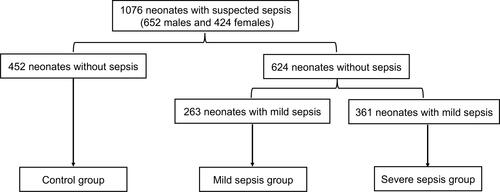
Table 2 The Presence and Severity of Neonatal Sepsis According to CAR Tertiles
Table 3 Correlations Between CAR and Clinical Parameters
Table 4 Regression Analysis to Assess the Presence of Neonatal Sepsis and Severe Sepsis According to CAR Tertiles
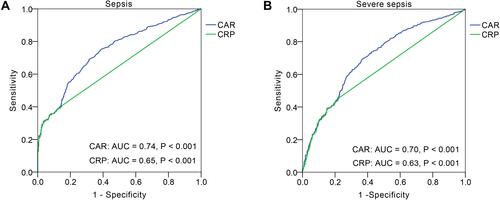
Figure 2 ROC curve of CAR, CRP, and ALB in predicting sepsis and severe sepsis in neonates. (A) The ROC curve for CAR, CRP, and ALB in predicting sepsis. (B) The ROC curve for CAR, CRP, and ALB in predicting severe sepsis.
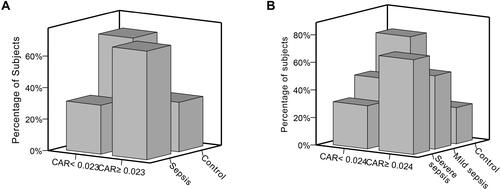
Figure 3 Distribution of neonates in high or low CAR groups. (A) The distribution of neonates with sepsis in high (≥0.023) or low (<0.023) CAR groups. (B) The distribution of neonates with severe sepsis in high (≥0.024) or low (<0.024) CAR groups.