Figures & data
Table 1 Detailed Baseline Characteristics of the Study Population
Figure 1 Time-dependent changes in the area under the curve (AUC) for overall survival of prognostic nutritional index (PNI), neutrophil-to-lymphocyte ratio (NLR) and platelet-to-lymphocyte ratio (PLR). (A) Temporal changes of the AUC, (B) ROC curves for 1-year mortality, (C) ROC curves for 3-year mortality.
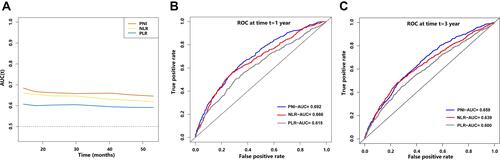
Table 2 The Association Between PNI Level and All-Cause Mortality in Overweight or Obese Patients with Cancer
Figure 2 Association of PNI levels with mortality (A) and Kaplan-Meier survival analysis of OS (B) in overweight or obese patients with cancer. Hazard ratios are indicated by solid lines and 95% confidence intervals (CIs) by shaded area. Reference point was calculated cut-off value (PNI=46.05). The model was adjusted for cofounders including age, gender, TNM stage, Eastern Cooperative Oncology Group performance status, tumor type, previous treatment, smoking and drinking status, weight loss, NRS score, hemoglobin levels, hand grip strength, calf-circumference, triceps skinfold, mid-arm circumference, calf circumference, diabetes mellitus, hypertension and coronary heart disease.
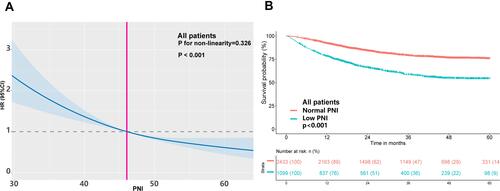
Table 3 The Association Between PNI and All-Cause Mortality Stratified by Age and Nutrition Status
Figure 3 Kaplan-Meier survival analysis for overweight or obese patients with cancer according to PNI levels stratified by tumor type. (A) OS of lung cancer; (B) OS of gastric cancer; (C) OS of esophagus cancer; (D) OS of colorectal cancer; (E) OS of nasopharyngeal carcinoma (NPC); (F) OS of breast cancer; (G) OS of hepatobiliary and pancreatic cancer (HPPC); (H) OS of cervical cancer; (I) OS of other cancer.
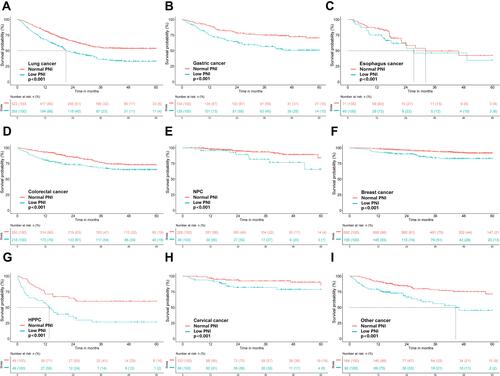
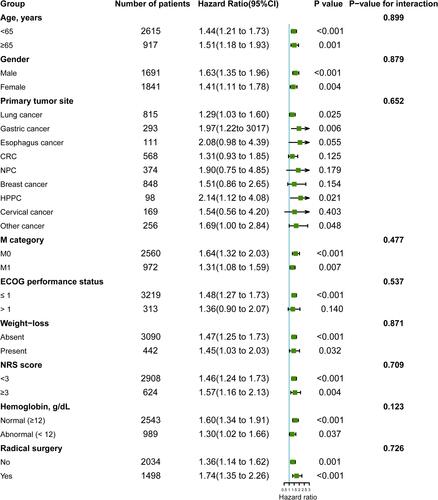
Figure 4 Subgroup analysis for evaluating the prognostic effect of PNI on overall survival.