Figures & data
Figure 1 Construction of the inflammatory response-related gene signature in the TCGA training set. (A) Risk score, survival time and survival status and expression of four genes in the TCGA cohort. (B) ROC curve and AUC of the four-gene signature classification. (C) KM survival curve distribution (overall survival, OS) of the four-gene signature in the TCGA cohort. (D) KM survival curve distribution (disease-free survival, DSS) of the four-gene signature in the TCGA cohort. (E) KM survival curve distribution (progression-free interval, PFI) of the four-gene signature in the TCGA cohort.
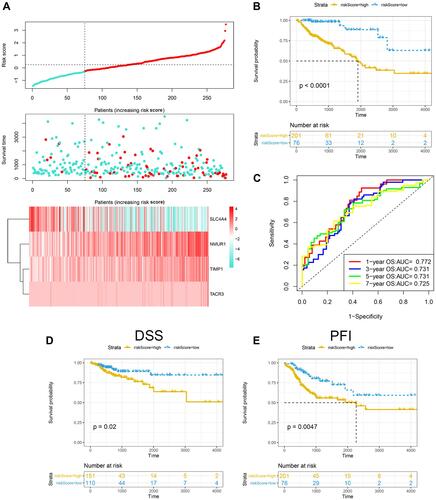
Figure 2 Validation of the prognostic performance of the IRGS in GSE39582. (A) Risk score, survival time and survival status and expression of four genes in the GSE39582 cohort. (B) ROC curve and AUC of the four-gene signature classification. (C) KM survival curve distribution of the four-gene signature in the GSE39582 cohort.
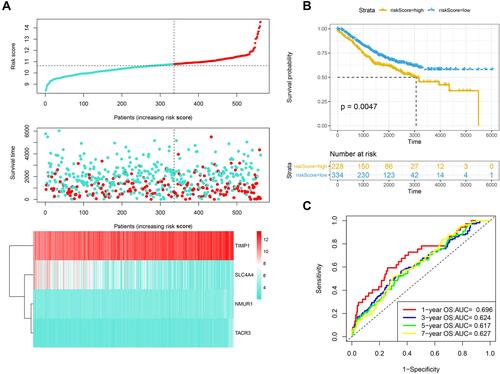
Figure 3 Validation of the prognostic performance of the IRGS based on 70 frozen tissues. (A) Risk score, survival time and survival status and expression of four genes based on 70 frozen tissues. (B) ROC curve and AUC of the four-gene signature classification. (C) KM survival curve distribution of the four-gene signature based on 70 frozen tissues.
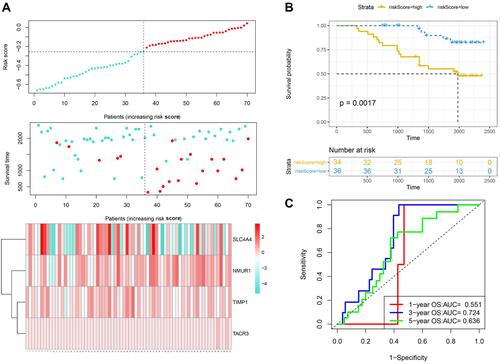
Figure 4 Analysis of patients with different clinical characteristics. Prognostic significance of the IRGS in COAD patients according to different clinical characteristics: male (A), female (B), N0 (C), N1-N2 (D), T1+T2 (E), T3+T4 (F), Stage 1–2 (G), Stage 3–4 (H). The risk score in different groups according to different clinical characteristics: T stage (I), N stage (J), M stage (K), tumor stage (L), lymphatic invasion (M), vascular invasion (N). **P < 0.01; ***P < 0.001 (versus control group).
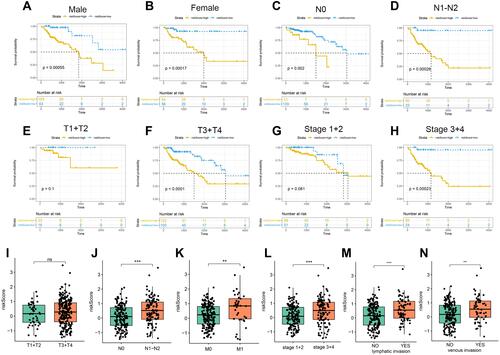
Figure 5 Association between the risk score and tumor microenvironment. Relationship between the risk score and ESTIMATES Score (A), Stromal Score (B) and Immune Score (C). (D) Distribution level of 22 types of immune cells in the high- and low-risk groups. ns, not significant; *P < 0.05; **P < 0.01; and ****P < 0.0001 (versus control group).
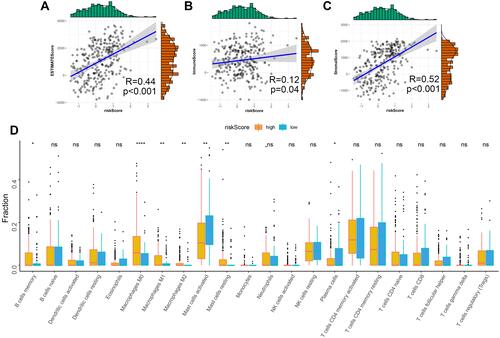
Figure 6 Gene set variation analysis and gene set enrichment analysis of pathways. (A) Heatmap showing the differentially expressed pathways between the low- and high-risk score groups based on GSVA analysis. (B) GSEA showed eleven pathways enriched in the high-risk group.
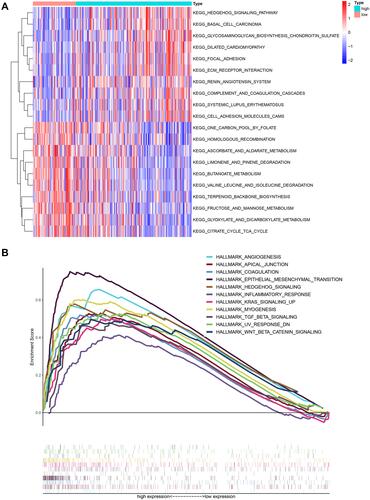
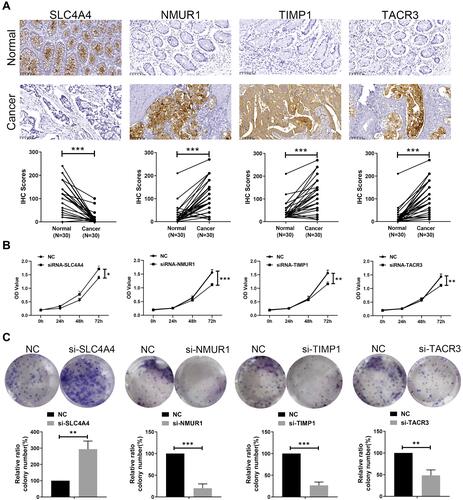
Figure 7 Protein level validation and functional analysis of 4 genes in the IRGS. (A) Immunohistochemical results showed that SLC4A4 was downregulated in colon cancer tissues, and NMUR1, TIMP1, TACR3 were highly expressed in colon cancer tissues. Magnification: 10*20. Cell viability assays (B) and colony formation assays (C) showed that silencing SLC4A4 promoted the proliferation of HCT116 cells, and silencing NMUR1, TIMP1 and TACR3 inhibited the proliferation of HCT116 cells, data represent mean ± SD; *P < 0.05, **P < 0.01 and ***P < 0.001 (versus control group).