Figures & data
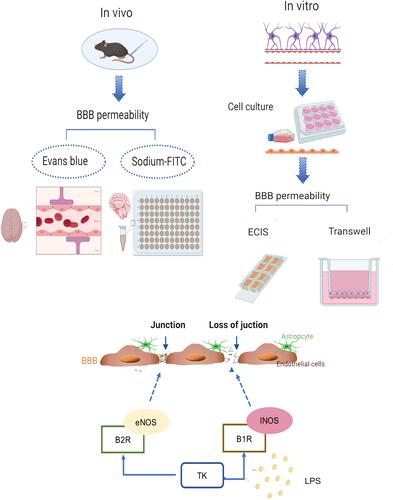
Figure 1 Tissue kallikrein (TK) increases normal blood–brain barrier (BBB) permeability in mice. The mice were divided into four groups: Control (PBS); TK-S (standard dose of TK); TK-M (medium dose of TK); TK-H (high dose of TK). (A) The content of Evans blue was qualitatively analyzed by brain images. (B) The content of Evans blue (mg/g of tissue) was quantitatively detected in the supernatant of the brain homogenate. ****P<0.0001. (C) Brain water content. ****P<0.0001. (D) The content of sodium-FITC in the supernatant of brain homogenate was quantitated (mg/g of tissue). ****P<0.0001; &&&&P<0.0001, one-way analysis of variance among the four groups.
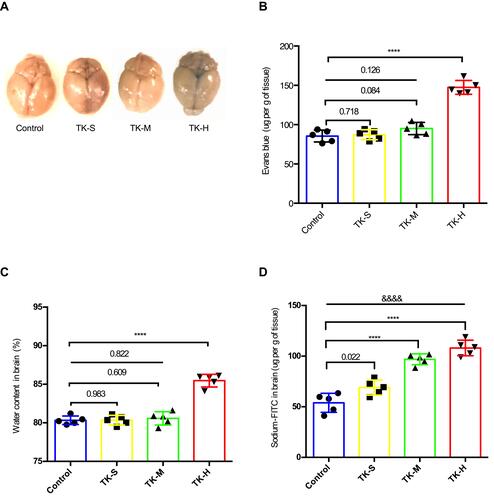
Figure 2 Blood–brain barrier (BBB) model in vitro. (A) Image of astrocytes. (B) Image of endothelial cells. (C) GFAP immunofluorescence staining of astrocyte. (D) vWF immunofluorescence staining of mice BMVECs. (E) Schematic of BBB model in vitro.
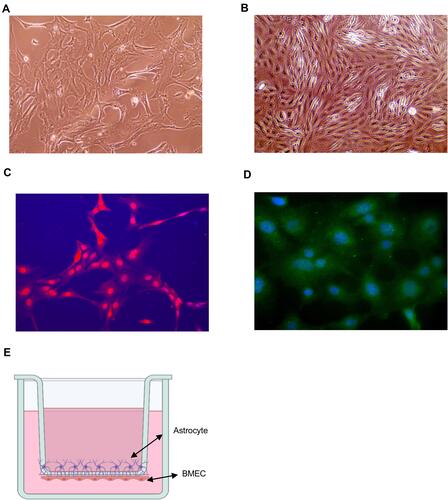
Figure 3 Effect of tissue kallikrein (TK) on blood–brain barrier (BBB) permeability in vitro. BMVECs were grown with primary mouse astrocytes in transwell chambers and treated with PBS, standard dose of TK (TK-S), medium dose of TK (TK-M), and high dose of TK (TK-H), LPS, LPS+ TK-S, and LPS+kallistatin. Then (A and C) red (40 kDa) or (B and D) blue (3 kDa) FITC-dextran was added to the chamber, and permeability was evaluated after 24 h by measuring the intensity of dextran fluorescence. **P<0.010; ***P<0.001; ****P<0.0001.
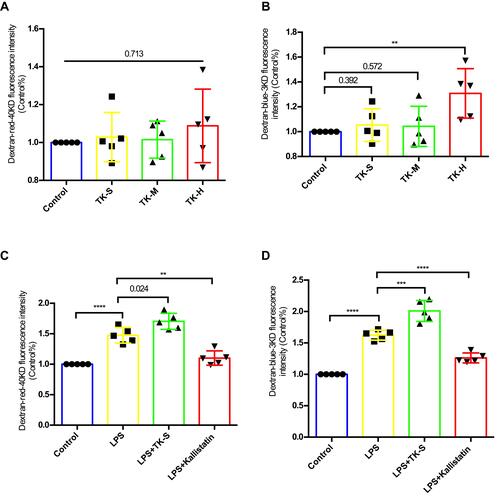
Figure 4 Effect of tissue kallikrein (TK) on the integrity of brain microvascular endothelial cell (BMVEC) monolayers. Transcellular electrical resistance (TER) measurements were recorded in monolayers of BMVECs during treatment with the indicated combinations of PBS, standard dose of TK (TK-S), medium dose of TK (TK-M), high dose of TK (TK-H), LPS, LPS+ TK-S and LPS+kallistatin. (A) Real time electric cell–substrate impedance sensing (ECIS) measurements were conducted using normalized TER to record BMVECs s permeability from 3 independent experiments. The lines denote the mean normalized resistance TERs ± standard deviation of the mean (SD). (B) Mean normalized TERs were measured from 3 independent experiments using ECIS. **P<0.010; ****P<0.0001.
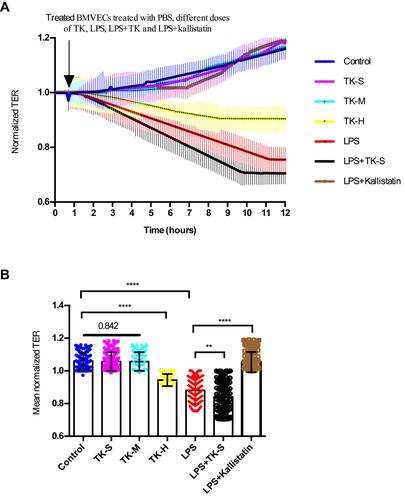
Figure 5 Tissue kallikrein (TK) regulates the abundance of ZO-1 in brain microvascular endothelial cells (BMVECs). (A–H) The abundance of ZO-1, bradykinin 1 receptor (B1R) and bradykinin 2 receptor (B2R) were evaluated by Western blot in BMVECs. BMVECs had been treated with PBS, standard dose of TK (TK-S), high dose of TK (TK-H), LPS, LPS+TK-S, and LPS+kallistatin. GAPDH abundance was also evaluated to confirm equal loading, and then (B and F) ZO-1, (C and G) B1R, (D and H) B2R were quantified via normalization to that of GAPDH. ***p<0.001; ****p<0.0001. (I) Immunofluorescence staining was used to detect the expression of ZO-1 in endothelial cells. BMVECs were incubated with ZO-1 primary antibodies and fluorescent secondary antibodies, and nuclei were counterstained with DAPI.
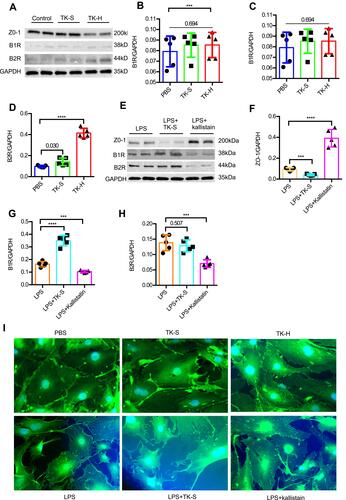
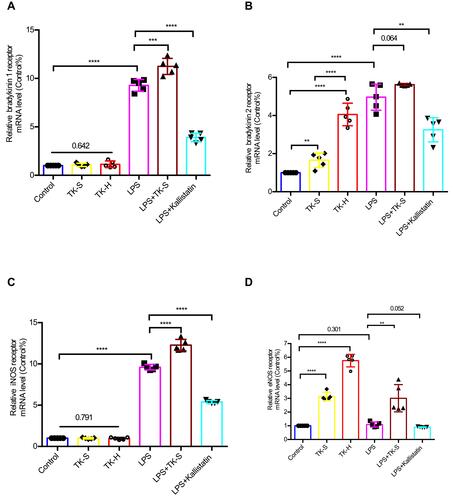
Figure 6 The mRNA levels of bradykinin 1 receptor (B1R), bradykinin 2 receptor (B2R), inducible nitric oxide synthase (iNOS), and endothelial nitric oxide synthase (eNOS) were evaluated via qPCR in brain microvascular endothelial cells (BMVECs). BMVECs were treated with PBS, TK-S, TK-H, LPS, LPS+TK-S, and LPS+kallistatin. B1R (A), B2R (B), iNOS (C) and eNOS (D) mRNA abundance were evaluated via q-PCR in BMVECs. **P<0.010; ***P<0.001; ****P<0.0001.