Figures & data
Figure 1 Images depicting L6 skeletal muscle myoblasts from rats, differentiated into L6 skeletal muscle myotubes (passage 7). (A) Myoblasts obtained on day 3 of the tissue culture in 10% FBS Ham F-10 media (10X). (B) Cells obtained on day 4 of the tissue culture in 6% horse serum Ham F-10 media (10X). (C) Myotubes obtained on day 5 of the tissue culture in 2% horse serum Ham F-10 media (10X). (D) Myotubes obtained after 4 hours of tissue culture in 2% delipidated serum Ham F-10 media (10X). (E) Myotubes obtained after one hour of cell starvation in only Ham F-10 media (10X). (F) Myotubes obtained after 19 hours of cell starvation in only Ham F-10 media (10X), (scale bar 50μm).
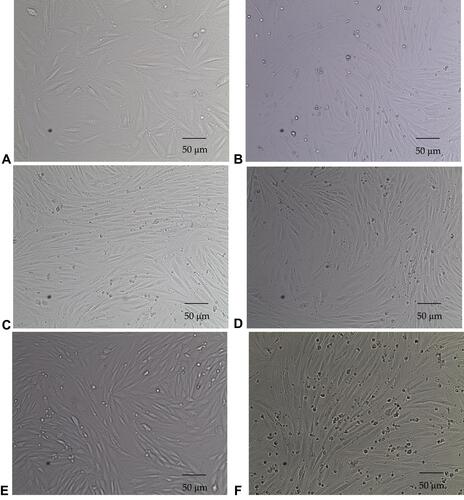
Table 1 List of Gene Primer and Probe Sequences
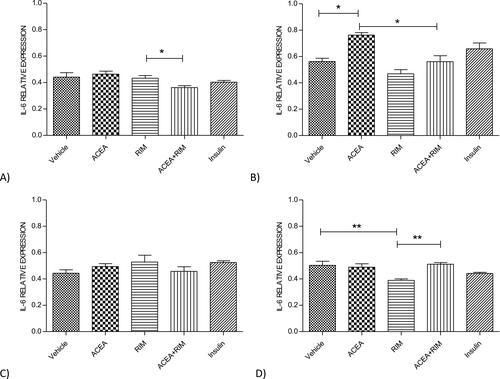
Figure 2 L6 muscle myotubes—ACEA, Rimonabant, ACEA and Rimonabant, and insulin affect IL-6 gene expression; myotubes fed with delipidated serum. The stimulation time covered 1 to 24 hours, and IL-6 mRNA levels, relative to TATA-Box, was evaluated by quantitative real-time PCR (qRT-PCR) (100 nM). The following scenarios explain the stimulation process conducted: (A) stimulation was done for 1 hour. (B) Stimulation was done for 3 hours. (C) Stimulation was applied for up to 5 hours. (D) Stimulation was applied for up to 24 hours. The data were reported as the mean ± SEM of three separate groups. (n=3; *denotes p=0.05 and **denotes p=0.01). Data were investigated by conducting one-way ANOVA test and Tukey’s test.