Figures & data
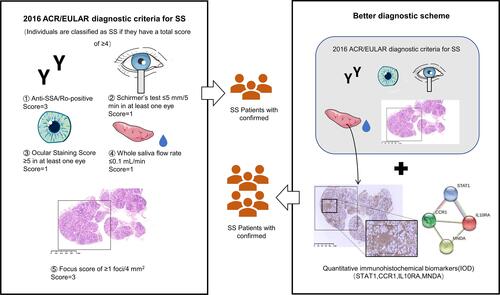
Table 1 Patients Clinical and Serological Information
Figure 1 Venn diagrams show the DEGs in the salivary glands of patients with SS. Venn diagrams showing the upregulated DEGs (A) and downregulated DEGs (B).
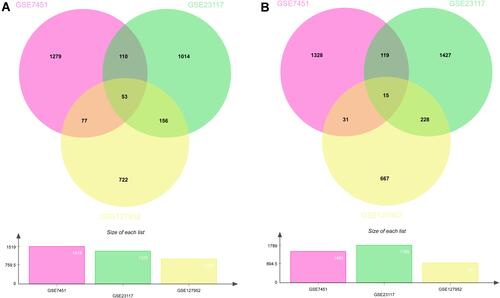
Figure 2 ClueGO enrichment analysis. Significantly enriched GO terms of DEGs in SS based on their GlueGO (Biological Processes) and CluePedia functions (A). The pie chart of ClueGO enrichment analysis (B).
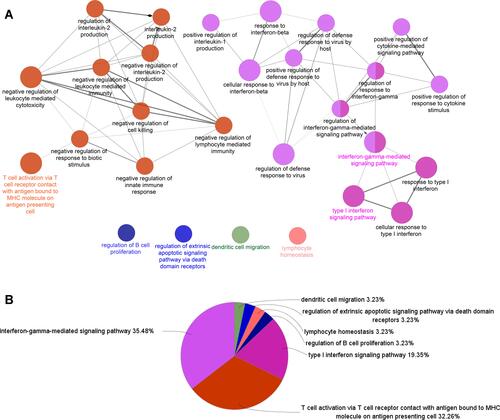
Figure 3 KEGG pathway terms of DEGs in SS. A histogram of KEGG enrichment analysis of upregulated genes, which shows a gradual change in color from red to purple, indicating the change in the P value from small to large (A). A histogram of KEGG enrichment analysis of downregulated genes (B).
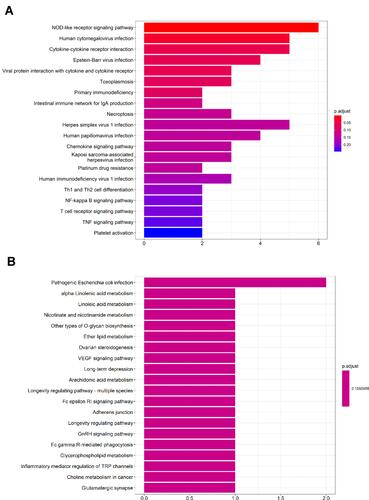
Figure 4 Protein–protein interaction (PPI) networks for 53 upregulated DEGs (A) and the top 20 hub genes (B) were constructed using Cytoscape visualization, which shows a gradual change in color from purple to yellow, indicating the change degree value from small to large.
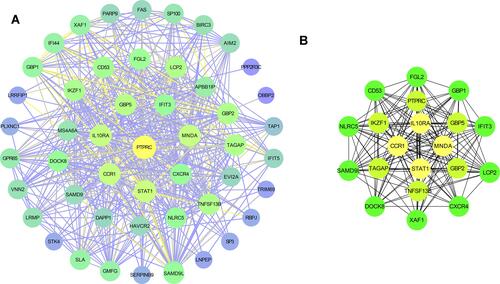
Figure 5 H&E and immunohistochemical analysis (A) of STAT1, MNDA, IL10RA, and CCR1 proteins in minor salivary gland biopsy (MSGB) staining from 14 SS patients and 14 non-SS patients (magnification: ×200 for H&E staining and ×200 for IHC). Blue marks the nucleus, and brown marks the target protein. The bar graph indicated medians with interquartile ranges of IOD value (B). ***P<0.001.
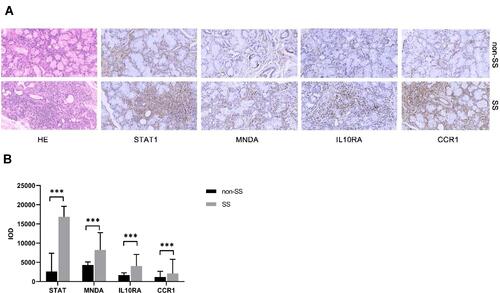
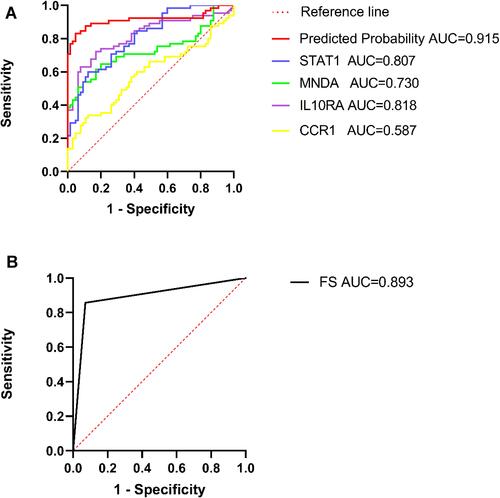
Figure 6 The single and combined diagnostic performance of the four genes. The diagnostic performance of FS (A). The diagnostic performance based on the IOD of four genes in SS patients (B). An AUC > 0.8 indicated that the predicted model had good efficacy.