Figures & data
Figure 1 Diagram of patient selection. SOFA, sequential organ failure assessment.
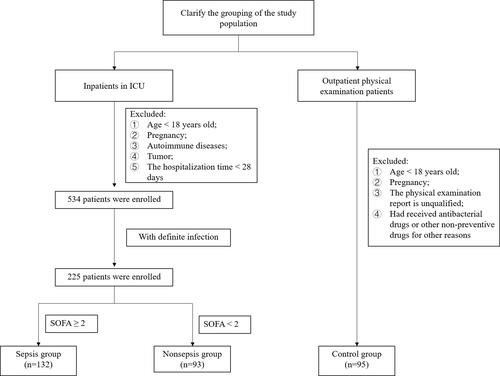
Table 1 Characteristics of the Study Population
Figure 2 The levels of C1q in sepsis patients with different infection condition. The data were described by interquartile range. (A) Different types of pathogens; (B) Different primary infection site. *P < 0.05, compared with HC (control group); #P < 0.05, compared with nonsepsis group.
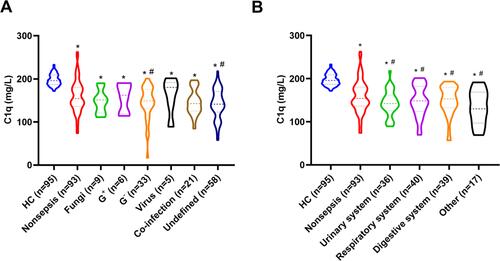
Figure 3 Analysis of C1q in sepsis group and septic shock group. (A) Comparison of C1q levels between sepsis group and septic shock group, the data were described by mean±SEM; (B) Incidence of septic shock with different levels of C1q.
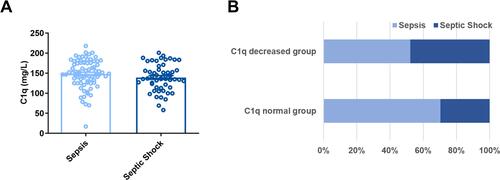
Figure 4 Analysis of C1q levels in survival group and death group of sepsis. (A) Comparison of C1q levels between survival group and death group of sepsis, the data were described by mean±SEM, *P < 0.05; (B) Sepsis mortality with different levels of C1q.
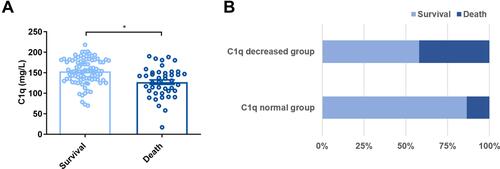
Figure 5 Correlation between C1q levels and SOFA. (A) C1q levels in different SOFA scoring group, the data were described by mean±SEM; (B) Scatter plot of correlation between C1q and SOFA score. *P < 0.05.
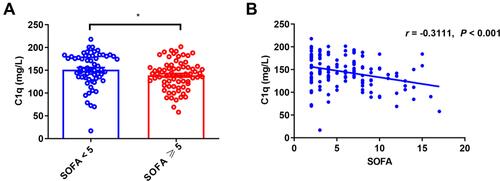
Figure 6 Analysis of C1q and laboratory indexes, the data were described by mean±SD. (A) AST; (B) ALT; (C) TBIL; (D) DBIL; (E) Urea; (F) NT pro-BNP; (G) CK-MB; (H) cTnI; (I) PLT; (J) PT; (K) TT; (L) FIB. *P < 0.05.
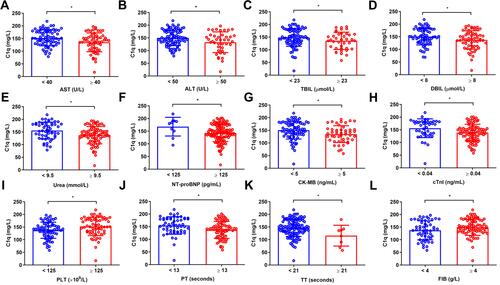
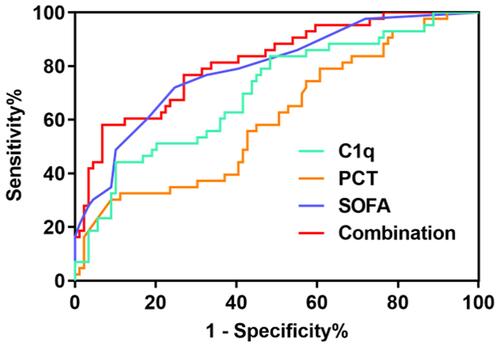
Table 2 The ROC Analysis of C1q for Predicting the Development of 28-Day Mortality in Sepsis
Figure 7 ROC curve of 28-day prognostic value of C1q in patients with sepsis.