Figures & data
Figure 1 Effects of PGRN on airway remodeling in HDM-challenged asthmatic mice. (A) Schematic diagram of the experimental plan for HDM-induced murine asthma. (B) H&E, PAS and Masson’s trichrome staining of lung sections from different groups. (C) The counts of total inflammatory cells in BALF from mice analyzed by Wright staining. (D) Levels of inflamed lung areas in mice. (E) Quantification of PAS-positive mucous cells in airways of each group. (F) Analysis of collagen deposition in airway tissues. Quantitation of lung morphology analysis was based on 5 random areas from each sample. Data are expressed as means ± SEMs of three independent experiments with four mice per group. #p<0.05 vs control group, ##p<0.01 vs control group, *p<0.05 vs HDM group.
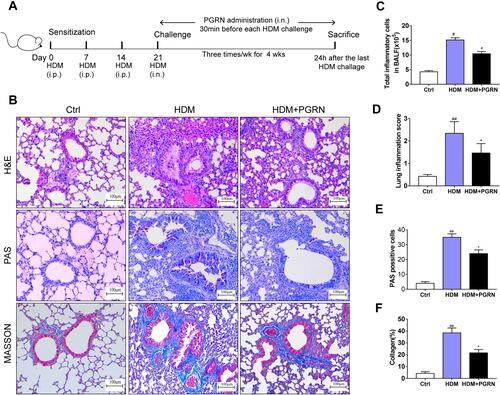
Figure 2 PGRN restrains HDM-induced collagen synthesis and fibrosis in mice. (A) Protein expression of α-SMA and collagen-I in mice was detected by immunohistochemical staining. (B and C) α-SMA and collagen-I expression levels according to average optical density. The relative mRNA expression of fibrosis-related genes including α-SMA (D), collagen-I (E), TGF-β1 (F), MMP-9 (G) were measured by qRT-PCR. For immunochemistry assay, results are obtained from 5 random areas of each sample. Data are expressed as means ± SEMs of three independent experiments with four mice per group. #p<0.05 vs control group, ##p<0.01 vs control group, *p<0.05 vs HDM group.
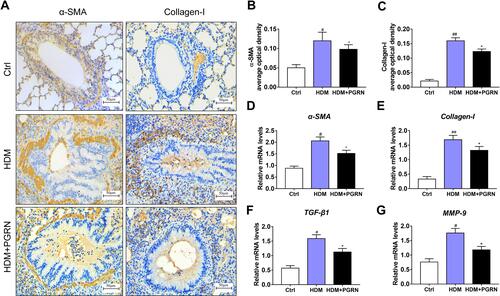
Figure 3 PGRN inhibits TGF-β1-mediated fibrotic process in BEAS-2B cells. (A) After the induction by 48h or 72h TGF-β1 (10ng/mL) with or without PGRN, Western blotting was performed to detect the expression of α-SMA, collagen-I and collagen-III. (B) Grey values of the indicated proteins were shown as bar graphs. (C) α-SMA expression (green) was detected by immunofluorescence assay in BEAS-2B cells under different treatments. (D) The ratio of α-SMA positive cells from different groups. Data are expressed as means±SEM of three independent experiments. #p<0.05 vs control group, #p<0.05 vs control group, ##p<0.01 vs control group, *p<0.05 vs TGF-β1 (24h) group, **p<0.01 vs TGF-β1 (48h) group, Δp<0.05 vs TGF-β1 (48h) group, ΔΔp<0.01 vs TGF-β (48h) group.
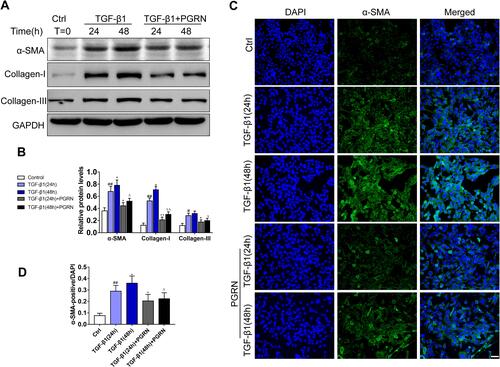
Figure 4 PGRN reduces airway autophagy in asthmatic mice and TGF-β1-treated BEAS-2B cells. (A) LC3 and Beclin-1 expression in airway tissues of mice was assessed by immunohistochemistry. (B and C) Semi-quantitative analysis showed that PGRN significantly decreased the expression levels of LC3 and Beclin-1 in mice exposed to HDM. (D) Representative TEM images of autophagosomes (red arrows) in TGF-β1-induced BEAS-2B cells with PGRN treatment or not. Scale bar=500nm. (E) Quantification of the numbers of autophagosomes in cells. (F) Apoptosis of cells was measured by the FITC-annexin V/PI assay. (G) Flow cytometry indicated that PGRN reduced apoptotic cell death in TGF-β1-treated cells. For analysis of immunochemistry assay, results are pooled from 5 random areas with four mice per group. Data are expressed as means±SEM of three independent experiments. #p<0.05 vs control group, ##p<0.01 vs control group, *p<0.05 vs HDM group, Δp<0.05 vs TGF-β1 (48h) group.
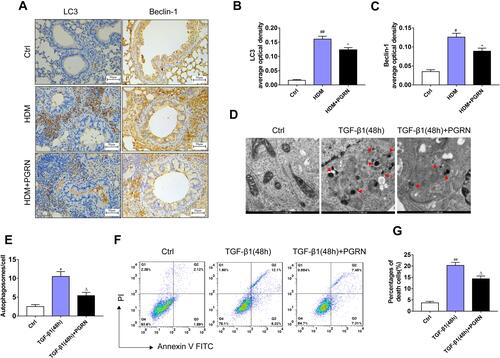
Figure 5 Effect of PGRN on HMGB1, RAGE and MAPK pathways in HDM-challenged mice. (A) PGRN downregulated HMGB1 and RAGE protein expression in mice lungs upon HDM exposure. (B) The effect of PGRN on phosphorylated and total JNK, ERK1/2, and p38 expression were evaluated by immunoblotting analysis. (C–F) Quantitative densitometric ratio of the above proteins normalized to GAPDH in each group. For immunoblotting analysis, data are expressed as means±SEM of three independent experiments with four mice per group. #p<0.05 vs control group, ##p<0.01 vs control group, *p<0.05 vs HDM group, **p<0.01 vs HDM group.
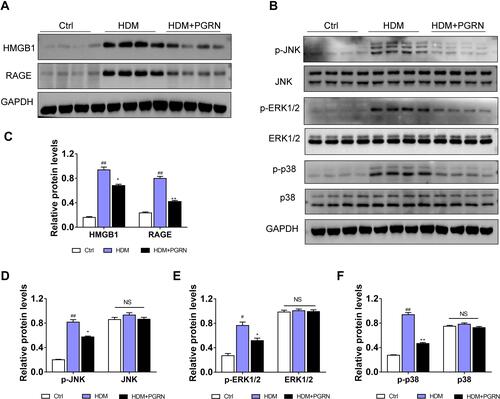
Figure 6 HMGB1 is responsible for the negative modulation of PGRN on autophagy under fibrotic conditions.(A) After silencing HMGB1, the expressions of autophagy (LC3, p62, Beclin-1) and fibrosis markers (α-SMA, collagen-I, collagen-III) in BEAS-2B cells were measured by Western blot. (B) Greyscale analysis of the above proteins. (C) Double immunofluorescence staining with LC3 and α-SMA in TGF-β1-treated BEAS-2B cells transfected with si-HMGB1 or si-NC in the presence or absence of PGRN. (D) Co-dying data (LC3 and α-SMA) was summarized as bar graph. Scale Bar=100μm. Data are expressed as means±SEM of three independent experiments. #p<0.05 vs control group, ##p<0.01 vs control group, *p<0.05 vs TGF-β1+si-NC group, **p<0.01 vs TGF-β1+si-NC group, Δp<0.05 vs TGF-β1+si-HMGB1 group.
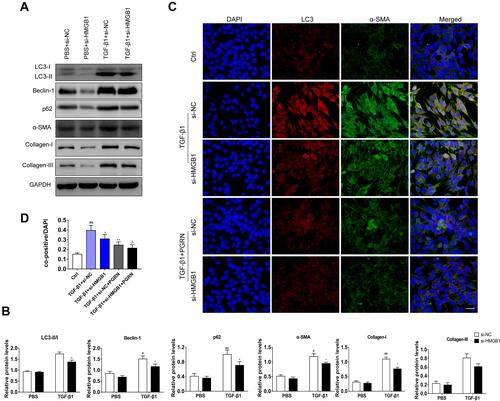
Figure 7 Increased extracellular HMGB1 offsets the inhibition of PGRN on TGF-β1-driven fibrosis through facilitating autophagy. (A) Immunoblotting analysis showed that PGRN or autophagy inhibitor 3-MA restrained expression of autophagy and fibrosis markers in BEAS-2B cells upon TGF-β1 exposure, while enhancement of extracellular HMGB1 by rHMGB1 pretreatment overturned this effect. (B) Relative densitometry of the indicated proteins to GAPDH was displayed as statistical graphs. (C) Representative images of mRFP-GFP-LC3 dual-fluorescence assay showed autophagic flux in BEAS-2B cells with different treatments. Scale bar= 20μm. (D) Quantification of the counts of autophagosomes (yellow dots) and autolysosomes (red dots) in merged images. Data are expressed as means±SEM of three independent experiments. #p<0.05 vs control group, ##p<0.01 vs control group, *p<0.05 vs TGF-β1 group, **p<0.01 vs TGF-β1 group, Δp<0.01 vs TGF-β1+PGRN group, ΔΔp<0.01 vs TGF-β1+PGRN group.
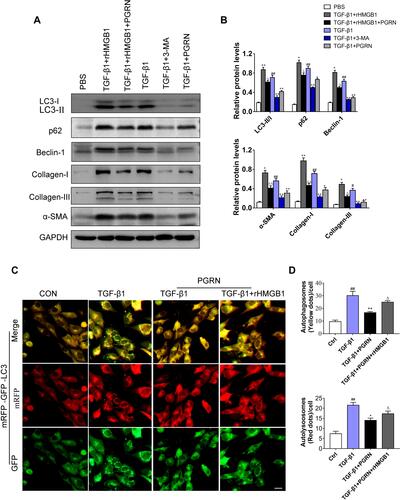
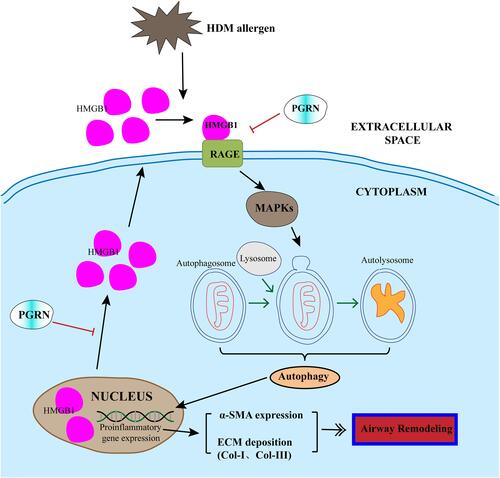
Figure 8 Schematic diagram illustrated the mechanism that HMGB1 is involved in the inhibition of PGRN on autophagic activity in HDM-induced airway remodeling. HDM exposure triggered the activation of HMGB1 and subsequent RAGE/MAPKs signaling pathway in airway epithelial cells, thus potentiating autophagy process and upregulating the expression of α-SMA and collagen proteins, then the formation of airway remodeling. PGRN could overturn HDM-induced HMGB1 overexpression, and further restrained autophagy and alleviated ECM production. Black lines: facilitation; Red lines: inhibition.