Figures & data
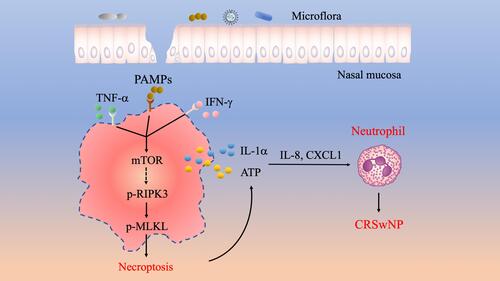
Table 1 Characteristics of Subjects
Figure 1 Prominent necroptosis is associated with CRSwNP. (A) TUNEL staining of control tissues and nasal polyps (Eos, Eosinophilic; Non-Eos, Non-eosinophilic). TUNEL positive cells were counted over high power field (400×) (n=15 per group). Scale bars: 200×, 100 μm; 400×, 50 μm. (B and C) Immunoblots and quantification of the protein levels over actin in control tissues and nasal polyps (n=20 per group). (D) IHC staining of cleaved caspase-3 (C-Casp3), cleaved gasdermin D (C-GSDMD) and p-MLKL in control tissues and nasal polyps. The positive cells were counted over high power field (400×) (n=15 per group). Scale bars: 50 μm. The data were shown as mean±SEM. NS, not significant; *p<0.05, **p<0.01, ****p<0.0001; by Mann–Whitney U 2-tailed test.
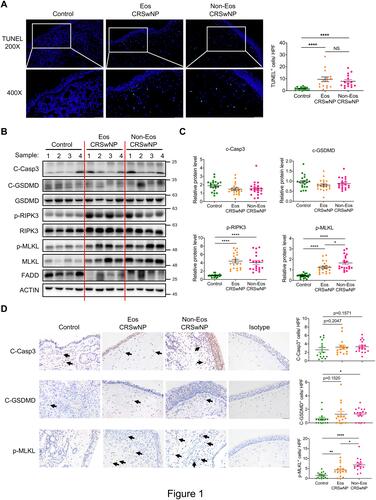
Figure 2 Necroptosis is correlated with neutrophilic inflammation in CRSwNP. (A and B) The protein levels of IL-8 and CXCL1 in tissue homogenates were detected by ELISA (n=22–24 per group). (C) Spearman correlations between IL-1α, HMGB1, IL-8, CXCL1 protein levels with p-MLKL positive cell numbers in control tissues and nasal polyps (n=28) (D) IHC staining of Myeloperoxidase (MPO), Neutrophil Elastase (NE) and Eosinophil Cationic Protein (ECP) in control tissues and nasal polyps. The positive cells were counted over high power field (400×) (n=15 per group). Scale bars: 50 μm. (E) Spearman correlations between MPO, NE or ECP positive cell numbers with p-MLKL positive cell numbers and in control tissues and nasal polyps (n=30). The data were shown as mean±SEM. *p<0.05, **p<0.01, ***p<0.001, ****p<0.0001; by Mann–Whitney U 2-tailed test.
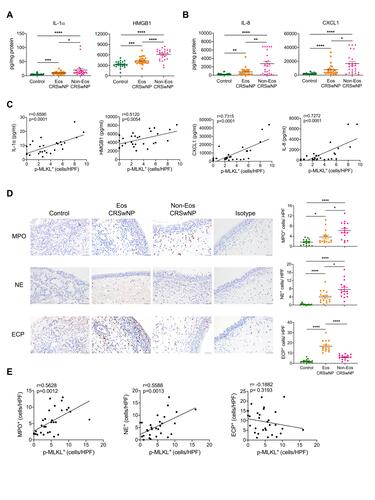
Figure 3 DAMPs facilitate inflammation in CRSwNP. (A and B) qPCR analysis of inflammatory cytokines and chemokines mRNAs (normalized to beta-actin) in primary nasal polyp cells before and after IL-1α (50 ng/mL), ATP (1 mM) or HMGB1 (1 μg/mL) stimulation for 8 h (n=12). (C) Spearman correlations between IL-1α and IL-8, CXCL1 protein levels in control tissues and nasal polyps (n=33). The data were analyzed by paired Student’s t-test (A and B).
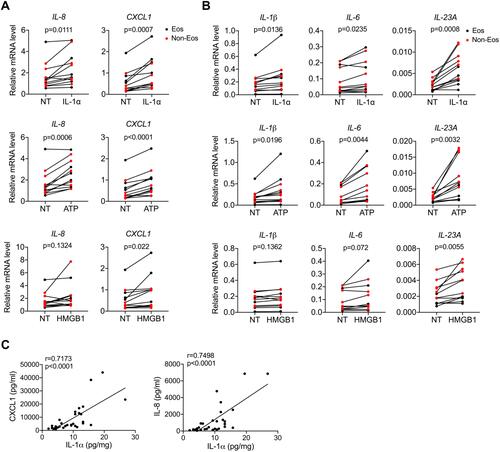
Figure 4 Prominent p-MLKL expression in macrophages in CRSwNP. (A) IF staining of p-MLKL (green) with specific immune cell markers (red) in nasal polyp sections. Arrows indicate double positive cells. The sections were counterstained with DAPI (blue). Scale bars: 20 μm. (B) The mean percentages of different cell types expressing p-MLKL in total p-MLKL+ cells in nasal polyps were shown (n=11). (C) The mean percentages of p-MLKL+ cells in total CD68+ cells were calculated in nasal polyps (n=10). (D) IHC staining of CD68 in control tissues and nasal polyps. The positive cells were counted over high power field (400×) (n=10–11 per group). Scale bars: 50 μm. The data were shown as mean±SEM. ***p<0.001, ****p<0.0001; by Mann–Whitney U 2-tailed test.
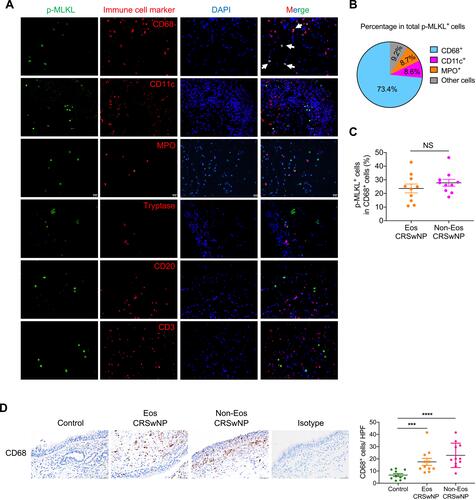
Figure 5 TNF-α and IFN-γ promote mTOR activation and necroptosis in macrophages. (A) The protein levels of TNF-α FasL, TRAIL, IFN-β and IFN-γ in tissue homogenates were detected by ELISA (n=22–24 per group). (B) THP-1 cells were treated with TNF-α (50 ng/mL) and IFN-γ (50 ng/mL) alone or together for indicated times. Cell viability and cytotoxicity were measured by intracellular ATP content or lactate dehydrogenase (LDH) release respectively. (C) THP-1 cells were treated with TNF-α (50 ng/mL) plus IFN-γ (50 ng/mL) in the presence or absence of Ac-YVAD-CMK (YVAD, 40 μM), z-DEVD-FMK (DEVD, 40 μM), z-VAD (40 μM), GSK’872 (5 μM) or NSA (1 μM) for 48 h. Cell viability and cytotoxicity were measured as in (B). (D) Immunoblots of cell lysates from THP-1 cells treated with TNF-α (50 ng/mL) plus IFN-γ (50 ng/mL) for indicated times. (E) THP-1 cells were treated with TNF-α (50 ng/mL) plus IFN-γ (50 ng/mL) with or without various doses of mTOR inhibitors rapamycin (rapa) or torin-1 for 48 h. Cell viability and cytotoxicity were measured as in (B). (F) Immunoblots of cell lysates from THP-1 cells treated with TNF-α (50 ng/mL) plus IFN-γ (50 ng/mL) with or without torin-1 (100 nM) for indicated times. The data were representative of 3 independent experiments (B–F) and shown as mean±SEM. *p<0.05, **p<0.01, ***p<0.001, ****p<0.0001; by Mann–Whitney U 2-tailed test (A) or one-way ANOVA (B, C and E).
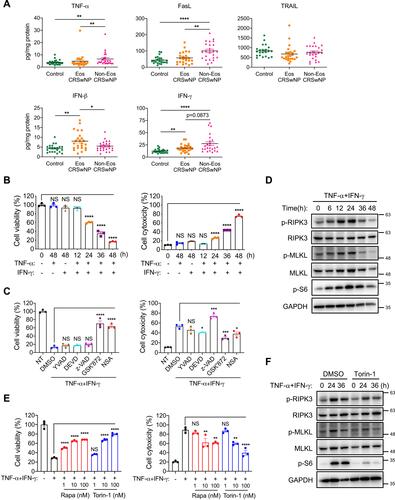
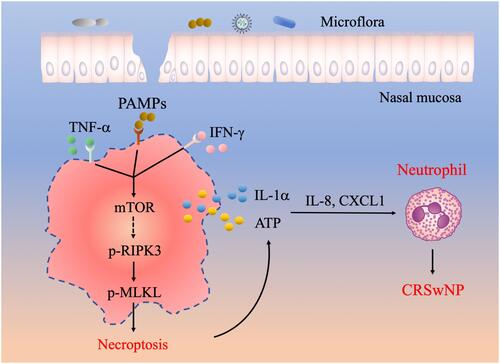
Figure 6 A working model illustrating the potential role of necroptosis in the pathogenesis of CRSwNP. The presence of TNF-α, IFN-γ and PAMPs in the nasal mucosa can cause RIPK3/MLKL dependent necroptosis and cell membrane rupture, which leads to the release of DAMPs such as IL-1α and ATP. DAMPs further stimulate the expression of proinflammatory cytokines and chemokines including IL-8 and CXCL1 to recruit neutrophils and exacerbate inflammation in CRSwNP.