Figures & data
Figure 1 Study flowchart of participant recruitment. A schematic overview of the inclusion and exclusion criteria and the number of excluded subjects, and the number of patients finally included. Briefly, a total of 634 COVID-19 patients were included. 451 patients were removed from the study for either refusal to participate or in loss to the follow-up. Of the remaining 183 patients, 105 patients with underlying diseases before admission were excluded. The remaining 78 patients were stratified and assigned into a RM group and a RC group based on the severity of illness at admission. Meanwhile, we included 39 HCs and 18 RAs against criteria, serving as the control group. No statistically significant differences in age, sex, and body mass index (BMI) were found between HC and different recovered groups.
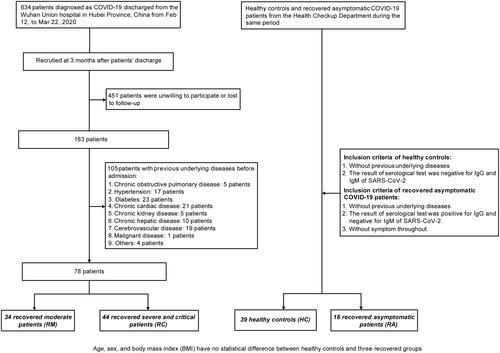
Table 1 Clinical and Laboratory Findings of Healthy Controls and COVID-19 Patients
Table 2 Chest CT Findings Based on Manual Evaluation and Artificial Intelligence (AI) Analysis of Chest CT in Healthy Controls and Recovered COVID-19 Patients
Figure 2 CT images and quantitative analysis with artificial intelligence (AI) system. Vertical scans of four representative patients were illustrated: (A) A 52-year-old male from HCs; A 54-year-old male from Ras; A 52-year-old male from RMs; A 53-year-old male from RCs. (B) COVID-19 pneumonia lesions from a patient in RCs detected by the AI system are displayed with blue pseudo color.
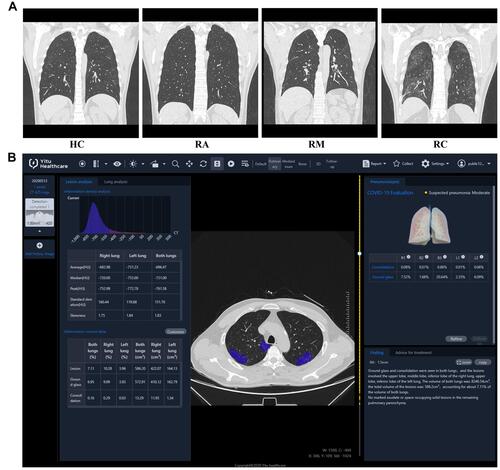
Figure 3 Plasma TNF-α and IL-6 concentrations of recovered COVID-19 patients and HCs. Plasma TNF-α (A) and IL-6 (B) were measured in healthy controls (HCs, n=39), recovered asymptomatic patients (RAs, n=18), recovered moderate patients (RMs, n=34), and recovered severe/critical patients (RCs, n=44) by ELISA. Data were expressed as boxplots with median and interquartile range. Significance of comparisons between RAs, RMs, or RCs vs HCs was determined by the Wilcoxon rank sum test and indicated as: ns (not significant), ****P < 0.0001.
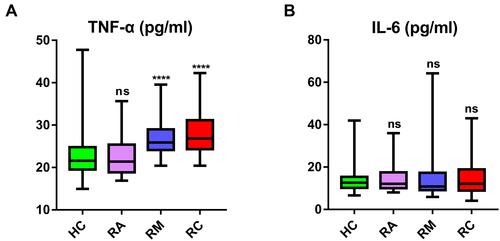
Figure 4 Profiling of metabolites from plasma samples of RMs and RCs as compared with HCs 3 months post discharge. Score plots of PLS-DA based on the 332 metabolites detected in the (A) RMs vs HCs and (B) RCs vs HCs. Venn diagram showing the number of differential metabolites in (C) RMs vs HCs and (D) RCs vs HCs. (E and F) Volcano plots of altered metabolites in RM, and RC patients as compared with HCs, the x-axis is the value of log2(FC), FC (fold change) represents the average level of metabolites in RMs or RCs relative to the average level in HCs, and the y-axis is -log (P value). The red dots represent the metabolites with two tailed P -value < 0.05.
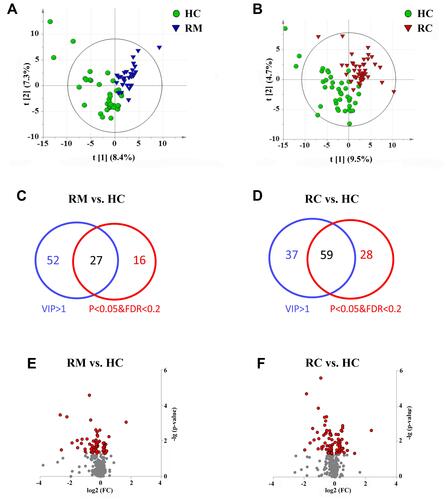
Figure 5 Significantly changed metabolites in RMs and RCs compared to HCs 3 months after discharge from hospital. (A) Heat map of changed metabolites in RMs and RCs as compared to HCs. Only differential metabolites with P <0.01, FDR <0.2, and VIP >1 are displayed, and the shades of the color indicate the relative level of metabolites (blue and yellow are indicative of relatively lower and higher level, respectively, and black shows the mean level). The disturbed metabolic pathways showed various metabolism changes when comparing (B) RMs to HCs, and (C) RCs to HCs. The value of P and pathway impact is calculated from the pathway enrichment and topology analysis, respectively. The node color is based on its p value and the node radius is determined based on their pathway impact values.
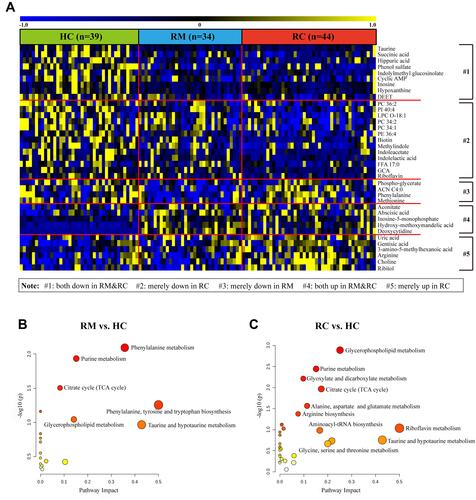
Figure 6 Potential correlations between clinical indexes and differential metabolites. Correlation matrix is based on Spearman interactions analysis of the levels of clinical indexes and differential metabolites found in recovered moderate (RM), severe and critical (RC) patients as compared to healthy controls (HC). The color-intensity indicates correlation strength. The red and blue colors signify positive and negative correlations, respectively. The greater the color-intensity, the stronger the correlation. *P <0.05; **P <0.01; ***P <0.001. Figures A-F present the significant potential correlations between differential metabolites and clinical indicators related to inflammation (A), the functions of kidney (B), lung (C), heart (D), liver (E), and coagulation system (F) respectively.
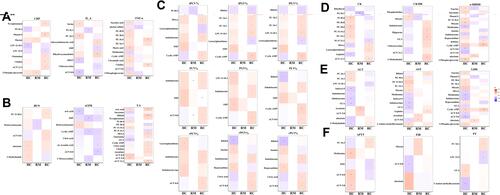
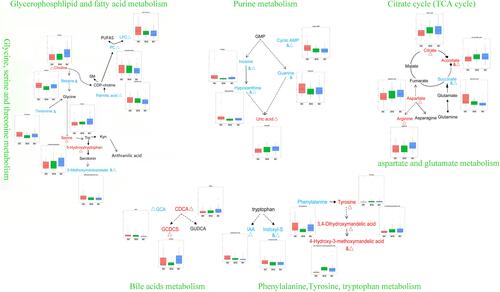
Figure 7 Main disordered metabolic pathways in RMs and RCs when compared with HCs 3 months after discharge. &, Δ the metabolite was obviously altered in the RMs and RCs when compared with HCs (RM vs HC with P <0.05 and FDR <0.2: &; RC vs HC with P <0.05 and FDR <0.2: Δ), respectively. The color of red and blue for metabolites illustrated that the metabolite was increased or decreased in RMs and/or RCs when compared with HCs, respectively.