Figures & data
Figure 1 Expression of CXCL12 and DPP4 in keloids and mature scars. (A) Immunohistochemical staining of CXCL12 and DPP4 in mature scar tissue (n=11) and various sites of keloid scarring (n=12). Bars=200μm. (B) Quantification of DPP4 activity (microunit/mL) and CXCL12 (pg/mL) in tissue homogenates from healthy subjects (n=9) and keloid patients (n=11). Correlation analysis of DPP4 activity and CXCL12 was performed for each group. **P < 0.01, ***P < 0.001.
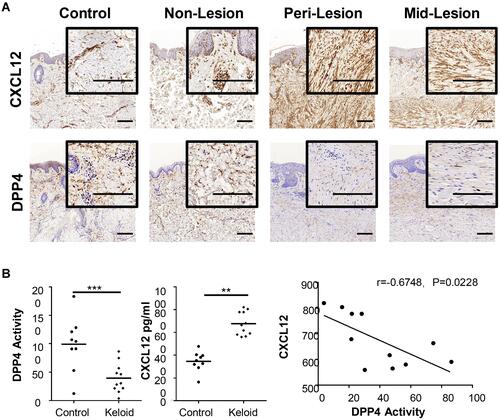
Figure 2 Inhibition of DPP4 increased extracellular CXCL12 without inducing CXCL12 expression. (A) Western blot and flow cytometry analyses of DPP4 in normal human dermal fibroblasts (NHDF) (n=3) and keloid-derived fibroblasts (KFs) (n=3). (B) ELISA analyses of CXCL12 in the culture supernatant of NHDFs (n=3) after inhibition of DPP4 activity. (C) ELISA analyses of CXCL12 in cell lysate of NHDFs (n=3) after linagliptin treatment (10nM). ns= P>0.05, ***P < 0.001.
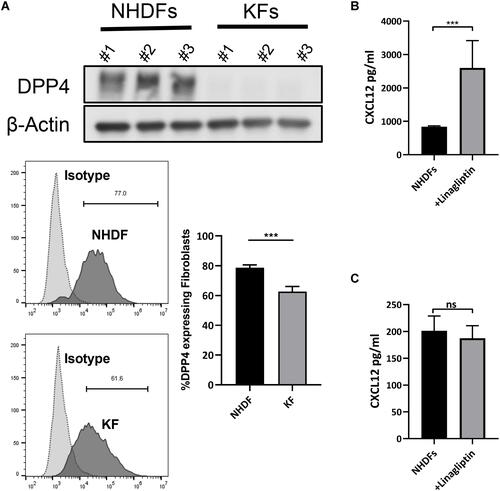
Figure 3 TGF-β1 increased extracellular CXCL12 without inducing CXCL12 expression. (A) Detection of TGF-β1 and CXCL12 expression in NHDFs (n=3) and KFs (n=3) by real-time PCR analyses. (B) Western blot analyses of TGF-β1 in NHDFs (n=3) and KFs (n=3). (C) Expression of CXCL12 in the cell supernatant of NHDFs (n=3) after TGF-β1 treatment (10ng/mL) was measured by ELISA. (D) Expression of CXCL12 in the cell lysate of NHDFs (n=3) after TGF-β1 treatment (10ng/mL) was measured by real-time PCR and ELISA; ns= P>0.05, ***P < 0.001. ns= P>0.05, ***P < 0.001.
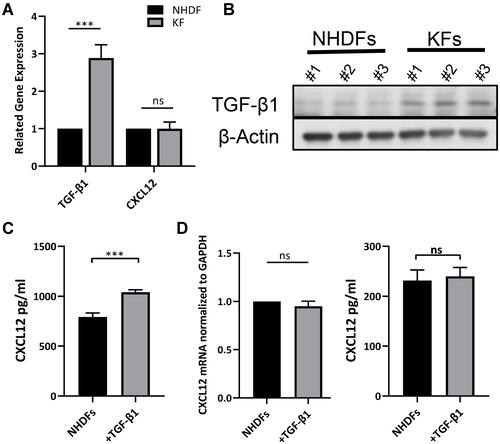
Figure 4 TGF-β induced CXCL12 accumulation through inhibition of DPP4 expression. (A) Western blot and flow cytometry analyses of DPP4 in NHDFs (n=3) after TGF-β1 treatment (10ng/mL). (B) The phosphorylation of smad2 in NHDFs after TGF-β treatment (10ng/mL) with or without vactosertib (500nM) was detected by Western blot. (C) ELISA analyses of DPP4 in KFs (n=3) after TGF-β1 treatment with or without vactosertib (500nM). (D) Western blot and flow cytometry analyses of DPP4 in KFs (n=3) after vactosertib (500nM) or siTGF-β1 treatment. (E) Immunofluorescence analysis of DPP4 and TGF-β1 expression in keloid tissue (n=12). Immunofluorescence sections prepared from the keloid tissue specimens. Fibroblasts were stained with anti-S100A4 antibody and are shown in the small window. Bars=50μm. ns= P>0.05, *P < 0.05, **P < 0.01, ***P < 0.001.
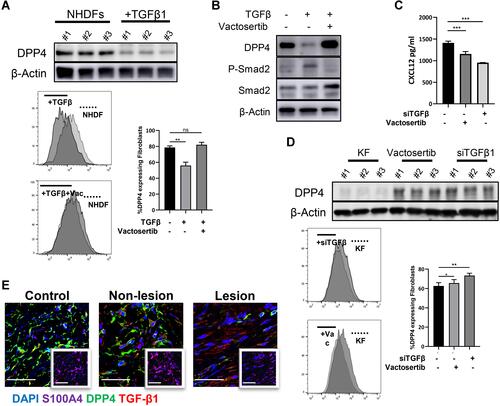
Figure 5 Infiltrated CXCR4+ inflammatory cells in keloid scars. (A) Immunohistochemical staining of CXCR4 and CXCR7 in mature scar tissue (n=11) and various sites of keloid scarring (n=12). The areas where inflammatory cells had infiltrated are amplified and shown in the small window. Bars=200μm. (B) Statistical analysis of CXCR4 and CXCR7 expression. ns= P>0.05, ***P < 0.001.
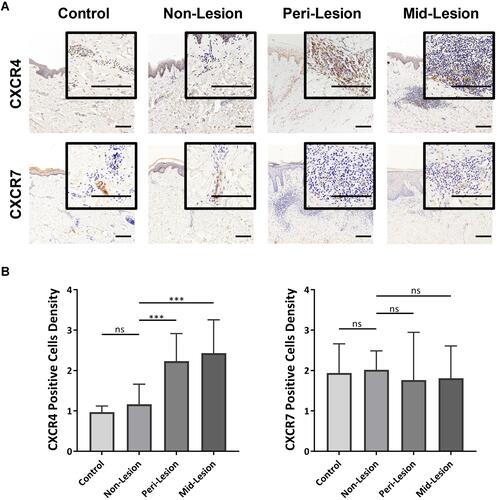
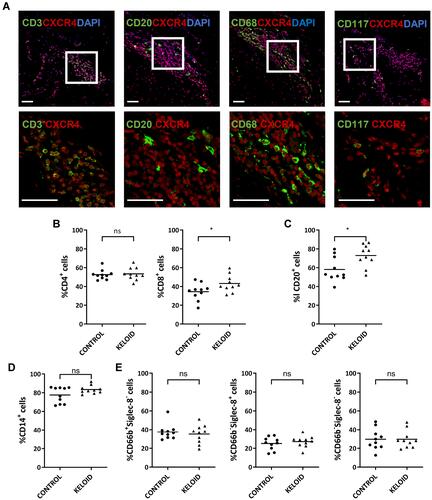
Figure 6 Expression of CXCR4 on circulating immune cells and keloid-resident inflammatory cells. (A) Immunofluorescence analysis of CXCR4 expression in different keloid-resident inflammatory cells (CD3+ T cells, CD20+ B cells, CD68+ macrophages and CD117+ mast cells) (n=12). Bars=50μm. (B–E) Flow cytometry analyses of CXCR4 expression in cycling CD4+ and CD8+ T lymphocytes (B), CD20+ B lymphocytes (C), CD14+ monocytes (D), and granulocytes, including CD66b+Siglec-8- neutrophils, CD66b−Siglec-8+ basophils, and CD66b−Siglect-8− eosinophils (E). Peripheral blood samples were collected from healthy subjects (Control) (n=10) and keloid patients (Keloid) (n=10); ns= P>0.05, *P < 0.05.