Figures & data
Table 1 Antibodies Used in the Experiment
Table 2 Primer Sequences
Figure 1 Serum total cholesterol concentration of the rabbits before and after modeling.
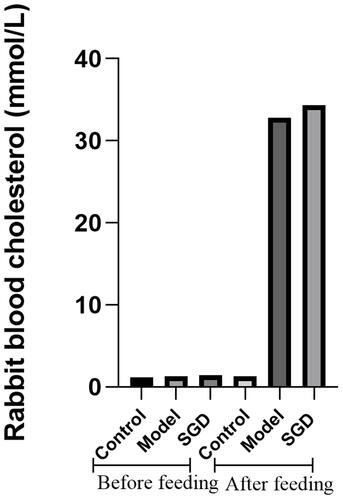
Figure 2 Hematoxylin and eosin staining of rabbit SO tissue (400×, 20 um), (A) Normal group, (B) Model group, (C) Treatment group. The arrow (←) refers to mucosal epithelial cells, the (*) refers to inflammatory cells infiltration.
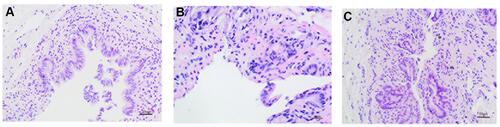
Figure 3 Rabbit SO tissue electron microscopy (1.0 um), (A) Normal group, (B) Model group, (C) Treatment group. The definitions of the abbreviations in the picture are as follows: interstitial cells of Cajal (ICC), smooth muscle cells (SMC), nucleus (N), nucleolus (Nu), mitochondria (M), rough endoplasmic reticulum (RER), collagen fibers (CF), dense spots (DPs), and dense bodies (DBs).
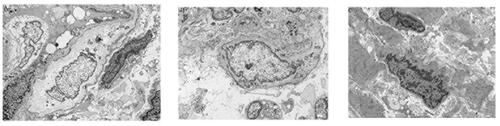
Figure 4 (A) Normal group, (B) Model group, (C) Treatment group: Rabbit SO tissue, nerve fiber PGP9.5 in the inner muscular layer detected by laser confocal microscopy, red light is PGP9.5, blue light is DAPI. (D) Normal group, (E) Model group, (F) SGD treatment group: α-actin labeled rabbit SO tissues were examined by laser confocal microscopy (400×, 20 um), with α-actin in red light and DAPI in blue light. (G) fluorescence intensity of PGP9.5 (IOD) in the SO tissue of rabbits in each group; (H) The fluorescence intensity (IOD) of α-actin labeled SMC in the SO tissue of rabbits in each group. Arrows indicate positive expression.*** indicates the comparison between the model group and the control group, P<0.05, ##indicates the comparison between the model group and the treatment group, P<0.05. In α-action, ** indicates the comparison between the model group and the control group, P<0.05, # indicates the comparison between the model group and the treatment group, P<0.05.
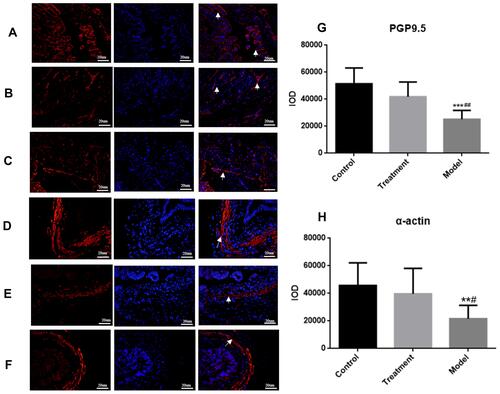
Figure 5 (A) Normal group, (B) Model group, (C) Treatment group: Rabbit SO tissue, nerve fiber in the inner muscular layer detected by laser confocal microscopy, SP and n-NOS respectively labeled SP nerve fibers (green light) and NO nerve fibers (red light) in rabbit SO tissue. The blue light is DAPI. Arrows indicate positive expression. ** indicates that the model group is compared with the control group, p<0.05, # indicates that the model group is compared with SGD group,p<0.05.In NO, ** indicates that the model group is compared with the control group, p<0.05, ## indicates that the model group is compared with SGD group, p<0.05.
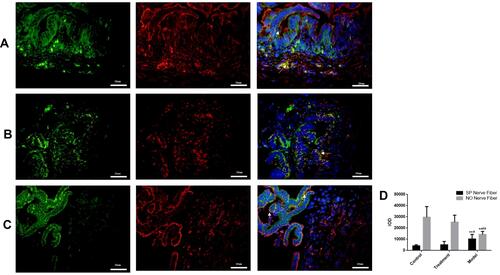
Figure 6 Results of ICC and TUNEL fluorescence staining in the SO tissue of rabbits (400×, 20 um); Blue is DAPI staining, red is c-kit positive ICC cell staining, green is TUNEL apoptotic cell staining. (A) Normal group, (B) Model group, (C) Treatment group, (D) ICC double positive expression rate. The model group vs the control group, ***P ≤ 0.001. The SGD group vs the model group, ###P ≤ 0.001. Arrows indicate positive expression.
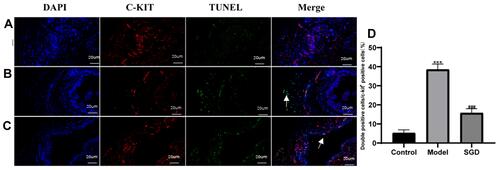
Figure 7 Immunohistochemical results of cleaved caspase-3, Bax, and Bcl2 in SO tissue (400×); a, b, and c: cleaved caspase-3 immunohistochemical results in the normal group, model group, and SGD treatment group, respectively; d, e, and f: Bax immunohistochemical results in the normal group, model group, and treatment group, respectively; g, h, and i: Bcl2 immunohistochemical results of the normal group, the model group, and the treatment group, respectively. The brown or brown cytoplasm is the expression of the corresponding positive protein (*). (A–C) The negative controls for cleaved caspase-3, Bax, and Bcl2 using control samples, respectively. (D–F) Respectively fluoresced caspase-3, Bax, and Bcl2 (IOD) in the SO tissue of rabbits in each group. The model group vs the control group, ***P ≤ 0.001. The SGD group vs the model group,##P≤0.01, ###P ≤ 0.001.
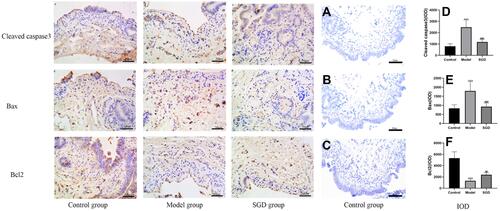
Figure 8 (A) the protein band; (B–E) the protein results of c-kit, Bcl2, Bax, and cleaved caspase-3 in rabbit SO tissue, respectively. The model group vs the control group, ***P ≤ 0.001, the SGD group vs the model group, #P ≤ 0.05, ##P ≤ 0.01, ###P ≤ 0.001.
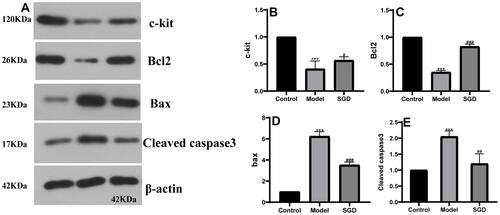
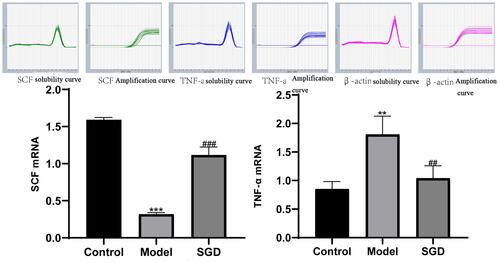
Figure 9 (A and B) the results of SCF and TNF-α mRNA in the SO tissue of rabbits in each group. The control group vs the model group, **P ≤ 0.01, ***P ≤ 0.001. The SGD group vs the model group ##P ≤ 0.01, ###P = 0.001 or less.