Figures & data
Figure 1 Overview of clinical study design, data acquisition and data analysis plan.
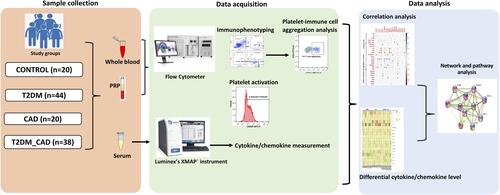
Figure 2 Measurement of platelets activation. (A) Identification of platelets according to their forward scatter and side scatter characteristic from platelet rich plasma. (B) CD62P (P-selectin) positive and (C) Pac-1 positive platelets were assessed from the platelet population. Comparison of percentage of (D) P-selectin positive platelets and (E) PAC-1 positive platelets in disease group also shown. One-way ANOVA used for comparisons between the study groups and p < 0.05 was considered significant. *p < 0.05, **p < 0.01, ***p < 0.001.
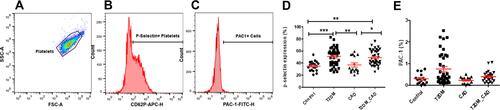
Table 1 Summary of Antibodies/Fluorochromes Used in This Study
Figure 3 Immunome profiling of monocytes, T lymphocytes, natural killer cells and dendritic cells. (A) Granulocytes, monocytes and lymphocytes were gated based on the forward scatter and side scatter characteristic from RBC lysed blood. (B) Confirmed monocyte (CD14+) (C) were gated further to get its subpopulation based on relative expression of CD16, and CD14. (D) NK cells were identified from CD3-ve population. (E) Lymphocytes were gated into CD3+ve (T cells) and CD3-ve cells. (F) CD3+ cells were further gated into T helper (CD4+), cytotoxic T cell (CD8+) and (G) NKT cells (CD56+). (H) Lineage -ve cells were identified. Lineage negative cells were gated into (I) dendritic cells and further into (J) plasmacytoid and myeloid dendritic cells. Comparison of percentage (K) classical monocytes, (L) intermediate monocytes, (M) non-classical monocytes, (N) CD4 T cells, (O) CD8 T cells, (P) NKT cells, (Q) NK cells, (R) total dendritic cells, (S) plasmacytoid dendritic cells, (T) myeloid dendritic cells in control, T2DM, CAD and T2DM_CAD groups. One-way ANOVA used for comparisons between the groups and p < 0.05 considered significant. *p < 0.05, **p < 0.01, ***p < 0.001.
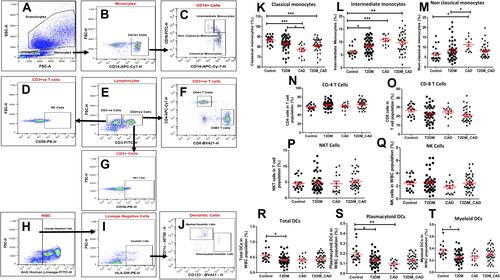
Figure 4 Measurement of platelet aggregation with immune cells. CD41a positive populations were identified as platelet and corresponding innate immune cell aggregate. Comparison of percentage of platelet aggregation with (A) monocytes (PMA), (B) neutrophils (PNA), (C) T cells (PTA), and (D) dendritic cells (PDA) in disease group. One-way ANOVA used for comparisons between the groups and p < 0.05 considered as significant. *p < 0.05, **p < 0.01, ***p < 0.001.
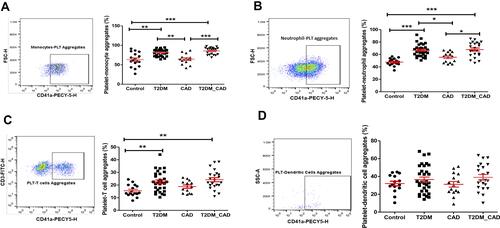
Table 2 Clinical and Biochemical Variables in Study Groups
Table 3 Percentage of All Cell Types and Platelet-Immune Cell Interaction or Aggregation in Study Groups
Figure 5 Measurement of circulating inflammatory markers. (A) Heat map showing the fold change of the circulating inflammatory markers across all the individuals belonging to the three different disease states. In order to derive the fold change, the median values of each inflammatory marker was obtained across all the healthy controls (control median). Further the fold change of a given inflammatory marker for a given patient was obtained as the log-ratio of the value of the marker in that patient divided by the control-median corresponding to that marker. (B) The median fold change of inflammatory markers in each disease cohort versus the control medians of each marker is also shown. X mark indicates statistically significant change as compared to control group (p < 0.05). (C) Venn diagram representing common and unique inflammatory markers in order to distinct T2DM, CAD, and T2DM_CAD as compared with control.
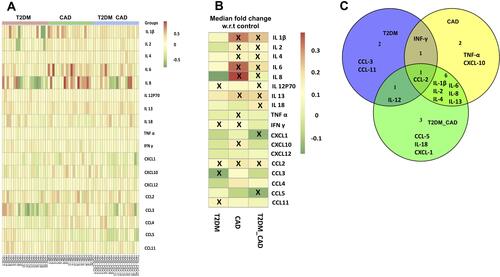
Figure 6 Heat map showing (A) the mutual Spearman correlations between the circulating inflammatory markers on the horizontal axis and the innate immune cells, their aggregate with platelet and platelet activation markers on the vertical axes. Background colour indicates strength of association. R value 0.3 was set as threshold and significance was considered as p < 0.05. (B) Heat map showing mutual Spearman correlations between the clinical characteristics on the horizontal axis and the innate immune cells, their aggregate with platelet and platelet activation markers on the vertical axes. Background colour indicates strength of association. R value 0.3 was set as threshold and significance was considered as p < 0.05. X mark indicates correlations having R ≥ 0.3 and p < 0.05.
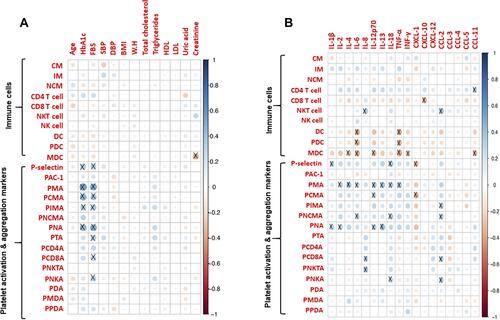
Figure 7 Protein-protein interaction network. STRING database analysis of medium-confidence protein interactions (interaction score, >0.4) between identified cytokines in T2DM_CAD patients. The circles represent proteins, while the straight lines represent the interactions between different proteins. The line thickness indicates the strength of evidence, with thicker connections indicating higher confidence in the protein-protein interaction.
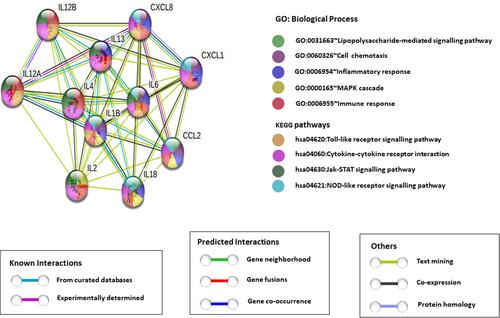
Figure 8 Effect of hyperglycemia on platelet-monocyte aggregate formation - Ex-vivo. (A) Confocal microscopic images of platelet-monocytes aggregate formation in different glucose concentration. Monocytes and platelets were incubated with 5 mM/L, 15 mM/L, and 30 mM/L D-Glucose, cells were fixed and stained with rhodamine phalloidin (F-actin, red) and DAPI (nuclei, blue). Scale bar = 25µm. (B) Quantification of hyperglycemia effect on platelet-monocyte aggregate formation by flow cytometer. Peripheral blood mononuclear cells and platelets were incubated with 5 mM/L, 15 mM/L, and 30 mM/L D-glucose for up to 8 hours. Monocytes were identified with CD14 APC-CY7 and monocytes aggregate formation with platelets were identified with the help of platelet specific marker CD41a Pecy5.
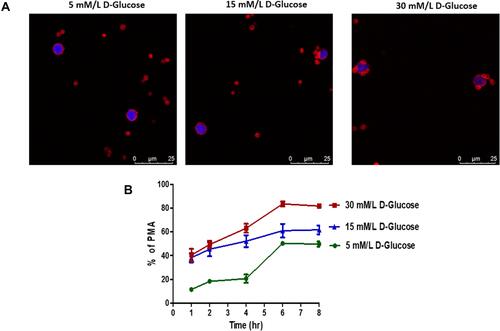
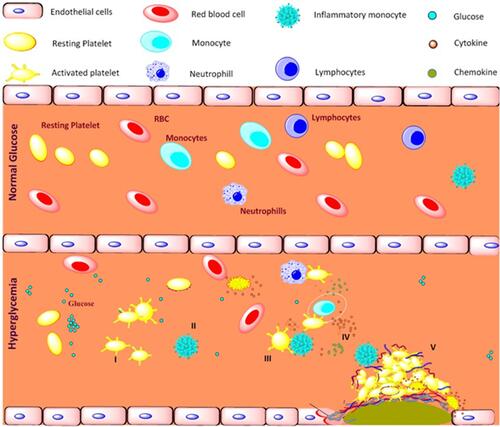
Figure 9 Schematic representation of platelet mediated inflammation process in type 2 diabetes and coronary artery diseases associated with type 2 diabetes. Long term exposure to the hyperglycemia condition and metabolic disturbance, I) activates platelets and II) shift monocytes towards inflammatory phenotypes, III) activated platelets aggregates with immune cells mainly monocytes, IV) triggers the release of pro-inflammatory, anti-inflammatory cytokines and chemokines, V) together contributes to development of atherosclerotic coronary artery diseases in type 2 diabetic patients.