Figures & data
Table 1 Sequences of the Primers Used for the Mice Liver and Skin Tissues
Figure 1 Photomicrograph of liver paraffin sections stain with (H&E). The black bars indicate 200 μm. The black arrows indicate necrotic cells.
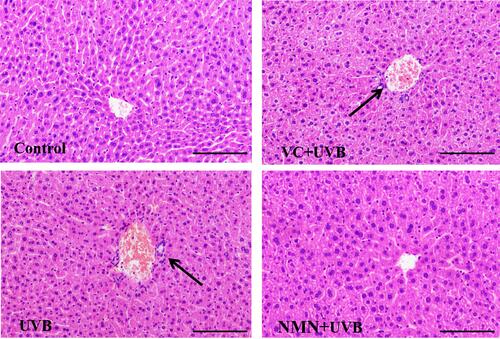
Figure 2 Photomicrograph of skin paraffin sections. (A) H&E staining of the skin; (B) Masson’s staining of the skin; (C) toluidine blue staining; (D) epidermal thickness of skin; (E) dermal thickness of skin; (F) number of mast cells of skin. *p < 0.05 compared to the UVB group; **p < 0.01 compared to UVB group; ***p < 0.001 compared to the UVB group. → ← in (A) indicate the thickness of dermis; ↑ in (B) indicate collagen fiber; ↑ in (C) indicate mast cell.
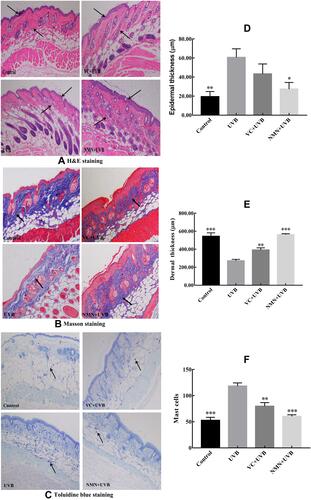
Table 2 Levels of Oxidative Stress Indicators in Serum of MiceA
Table 3 Levels of Oxidative Stress in Skin of MiceB
Table 4 Levels of Inflammatory Indexes in Serum and Skin of MiceC
Figure 3 Gene expression of SOD1, SOD2, CAT and GSH in skin and liver tissues. *p < 0.05 compared to the UVB group; **p < 0.01 compared to UVB group; ***p < 0.001 compared to the UVB group.
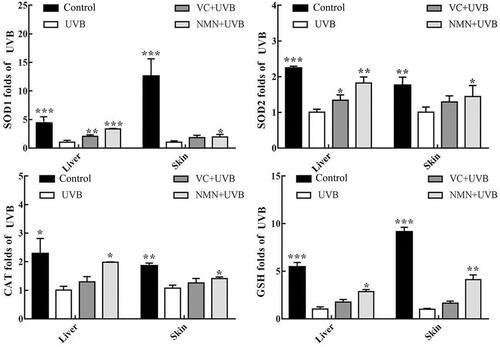
Figure 4 Gene expression of NF-κBp65, IκB-α, TNF-α, IL-6 and IL-10 in skin and liver tissues. *p < 0.05 compared to the UVB group; **p < 0.01 compared to UVB group; ***p < 0.001 compared to the UVB group.
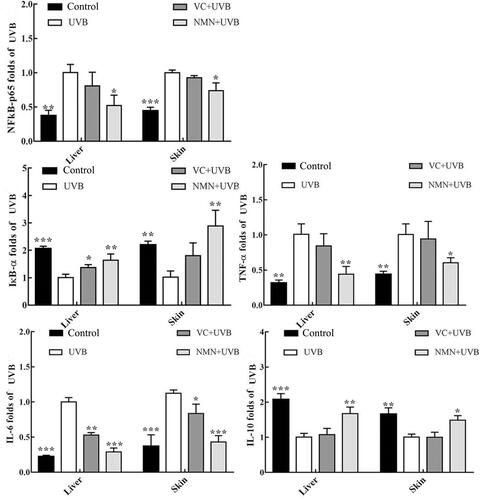
Figure 5 Gene expression of AMPK, SIRT1, LKB1, PGC-1α, APPL1, mTOR and FOXO in skin and liver tissues. *p < 0.05 compared to the UVB group; **p < 0.01 compared to UVB group; ***p < 0.001 compared to the UVB group.
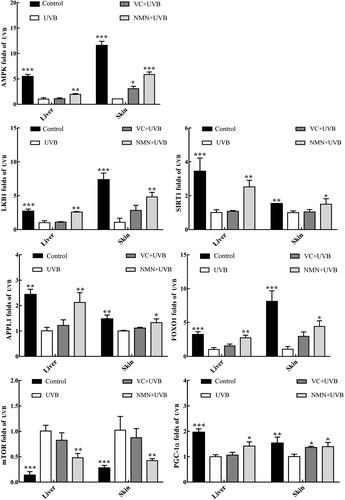
Figure 6 Protein expression of AMPK, NFκB-p65, IκB-α, SOD1 and CAT in skin tissues. (A) relative expression levels of proteins; (B) protein banding map. *p < 0.05 compared to the UVB group; **p < 0.01 compared to the UVB group; ***p < 0.001 compared to the UVB group.
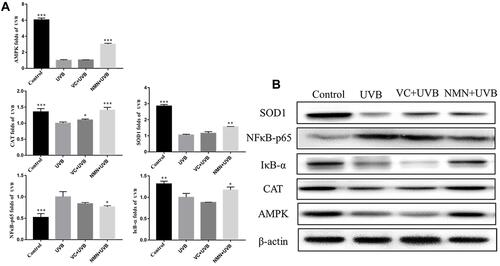
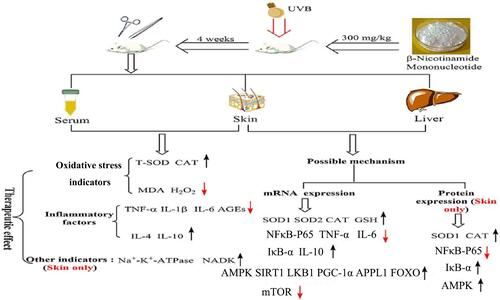
Figure 7 The possible mechanism of this study. The black arrows “↑” indicated those indicators were increased after intraperitoneal injection treatment with NMN, but the red arrows “↓” indicated those indicators were decreased after intraperitoneal injection treatment with NMN.