Figures & data
Table 1 Characteristics of Patients (n=567)
Figure 1 Kaplan-Meier survival curve of neutrophil-to-lymphocyte ratio related parameters for overall survival of CRC patients. (A) NLR-pre; The low NLR-pre group (NLR-pre ≤2.33) had better OS compared to high NLR-pre group (NLR-pre >2.33) (5 year OS: 82.6% versus 70.5%; p<0.001). (B) NLR-post; The low NLR-post group (NLR-post ≤2.06) was associated with better OS compared to high NLR-post group (NLR-post >2.06) (5 year OS: 80.1% versus 71.4%; p=0.003). (C) NLR-trend; The G1 (low NLR-pre and low NLR-post group) was significantly associated with better OS than the other groups (low NLR-pre and high NLR-post group, high NLR-pre and low NLR-post group and high NLR-pre) (5 year OS: 86.4%, 73.6%, 70.2% and 70.0% respectively, p=0.001). (D) NLR-delta; The low NLR-delta group (NLR-delta ≤-1.08) had worse OS compared to high NLR-delta group (NLR-delta >-1.08). (5 year OS: 69.5% versus 79.4%; p=0.003).
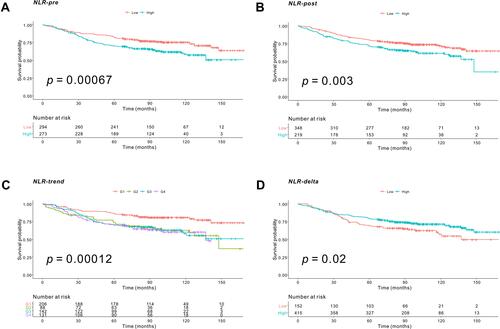
Table 2 Univariate and Multivariate Analysis of Factors Associated with Overall Survival (n=567)
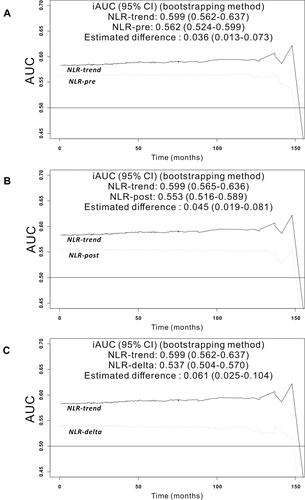
Figure 2 Predictive accuracy of the model during follow-up period was measured using the iAUC, a weighted mean of AUC over follow-up period. The time-dependent receiver operating characteristics curve of the NLR-trend was superior to that of NLR-pre (A) (bootstrap iAUC mean difference = 0.036; 95% CI 0.013–0.073), NLR-post (B) (bootstrap iAUC mean difference = 0.045; 95% CI 0.019–0.081) (B) and NLR-delta (C) (bootstrap iAUC mean difference = 0.061; 95% CI 0.025–0.104).