Figures & data
Figure 1 Altered lipid distribution in Bcl3-KO mice.
Notes: Male WT and Bcl3-KO mice were fed a ND or HFD for 16 weeks. (A) mRNA levels of BCL3 in Liver and EAT from WT and Bcl3-KO mice. (B) Development of body weight of Bcl3-KO and WT mice. (C) Appearance of mice. (D) Body weight and (E) food intake were monitored. (F) Depot mass of subcutaneous, epididymis, mesentery, perirenal WAT in WT and Bcl3-KO mice. Data in A-F represent means of n=5–8 mice/group ±SEM. *p < 0.05, **p < 0.01, ***p < 0.001 for Bcl3-KO versus WT mice.
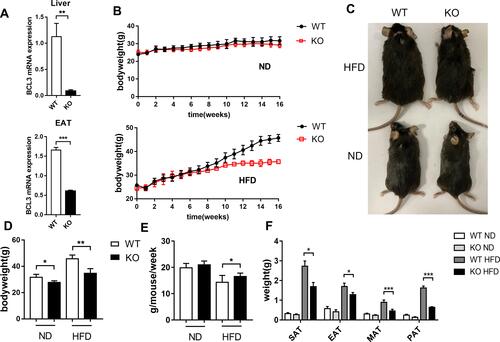
Figure 2 Hepatic steatosis was decreased in Bcl3-KO mice.
Notes: Murine liver tissues were retrieved after 16 weeks of ND or HFD feeding. (A) Liver image. (B) Microscope image of representative liver sections with H&E staining. (C) Liver weight. (D) Triglyceride in liver tissue. (E) Plasma levels of ALT,(F) TCH, (G) FFA and (H) TG in WT and Bcl3-KO mice. Data in A-H represent means of n=5–8 mice/group ±SEM. *p < 0.05, **p < 0.01, ***p < 0.001 for Bcl3-KO versus WT mice.
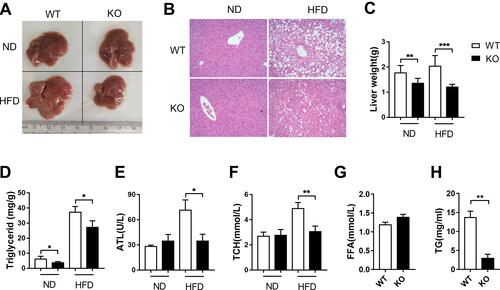
Figure 3 Improved glucose metabolism and insulin sensitivity in Bcl3-KO mice.
Notes: (A) Serial changes in glucose levels after intraperitoneal injection of insulin in WT and Bcl3-KO mice and (B) area under the curve (AUC) at 16 weeks for ND and HFD. (C) Serial changes in glucose levels after intraperitoneal injection of glucose in WT and Bcl3-KO mice and (D) area under the curve (AUC) at 16 weeks for ND and HFD. (E) Fasting blood glucose levels. (F) Western blot analysis of insulin-stimulated phospho-Akt S473 (pS473AKT) in EAT. (G) Insulin-stimulated pS473AKT in liver. Data in A-E represent means of n=5 mice/group ±SEM. *p < 0.05, **p < 0.01, ***p < 0.001 for Bcl3-KO versus WT mice.
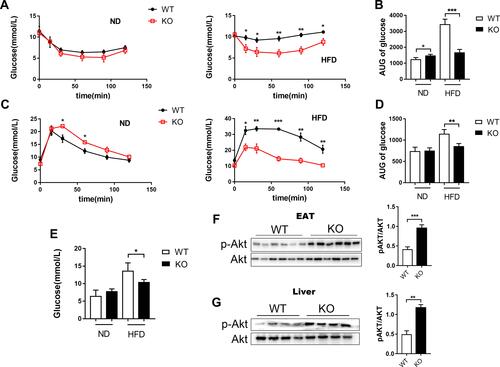
Figure 4 Improved adipocyte hypertrophy and improved adipocyte function in the absence of BCL3.
Notes: Adipose tissues (EAT) were retrieved after 16 weeks of ND or HFD feeding. (A) EAT image. (B) Representative H&E staining images of EAT of WT and Bcl3-KO ND-fed or HFD-fed mice. (C) Quantification of adipocyte number per image and area (μM). (D) mRNA levels of adiponectin and leptin in EAT from WT and Bcl3-KO mice. (E) Adipogenic potentials of WT versus Bcl3-KO ear mesenchymal stem cells (EMSC). Data in A-E represent means of n=4–6 mice/group ±SEM. *p < 0.05, **p < 0.01, ***p < 0.001 for Bcl3-KO versus WT mice.
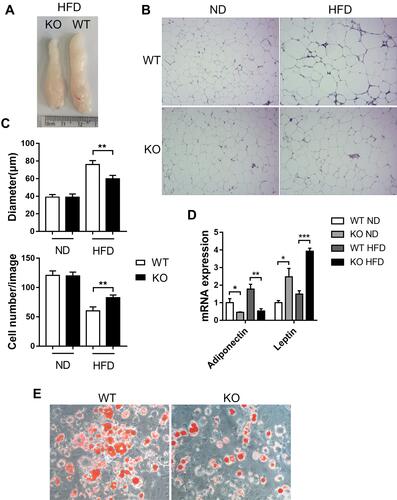
Figure 5 Down-regulation of lipid synthesis in Bcl3-KO mice.
Notes: (A) Western blot analysis of SREBP1, FAS, pACC, ACC, CPT1, ATGL protein expression in WT and Bcl3-KO ND-fed mice and (B) quantitative. (C) Western blot analysis of SREBP1, FAS, pACC, ACC, CPT1, ATGL protein expression in WT and Bcl3-KO HFD-fed mice and (D) quantitative. (E) Western blot analysis of nuclear-localized SREBP1 (nSREBP1) in WT and Bcl3-KO HFD-fed mice. Data in B and D represent means of n=4 mice/group ± SEM. *p < 0.05, **p < 0.01 for Bcl3-KO versus WT mice.
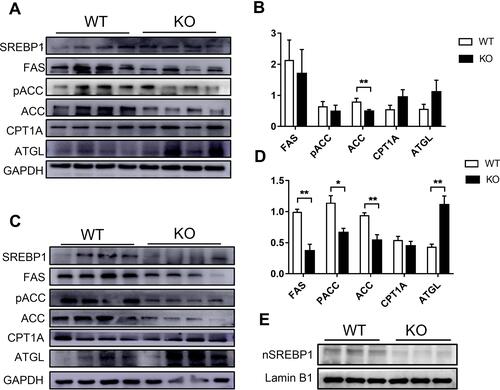
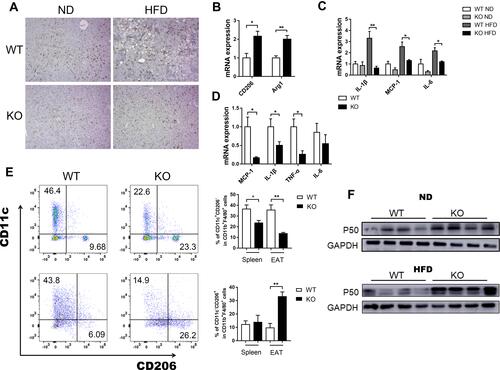
Figure 6 Decreased adipose and liver tissue inflammation in Bcl3-KO Mice.
Notes: (A) F4/80 immuno-staining in liver. (B) RT-PCR analysis for mRNA expression of CD206, Arg1 in liver. (C) RT-PCR analysis for pro-inflammatory cytokine mRNA expression of IL-1β, MCP-1, IL-6 in liver. (D) RT-PCR analysis for pro-inflammatory cytokine mRNA expression of IL-1β, MCP-1, TNF-α, IL-6 in EAT. (E) Representative flow cytometry analysis of macrophage subtype in spleen and EAT. (F) Western blot analysis of P50 protein expression in WT and Bcl3-KO ND-fed and HFD-fed mice. Data in A-D represent means of n=5–7 mice/group ±SEM. *p < 0.05, **p < 0.01 for Bcl3-KO versus WT mice.