Figures & data
Figure 1 (A) represents structure of 5-[(naphthalen-2-yloxy)methyl]-1,3,4-oxadiazole-2thiol (B3) and (B) the target protein gamma amino butyric acid (GABA) with protein data band (PDB I.D = 6D6T).
![Figure 1 (A) represents structure of 5-[(naphthalen-2-yloxy)methyl]-1,3,4-oxadiazole-2thiol (B3) and (B) the target protein gamma amino butyric acid (GABA) with protein data band (PDB I.D = 6D6T).](/cms/asset/8a915da2-738e-4cae-99d7-d943b221398f/djir_a_12190443_f0001_c.jpg)
Figure 2 (A–C) represent the three-dimensional structure of ligands 5-[(naphthalen-2-yloxy) methyl]-1,3,4-oxadiaszole2-thiol (B3), diazepam (DZM), and flumazenil (FLZ), respectively drawn using Discovery Studio Visualizer 2016.
![Figure 2 (A–C) represent the three-dimensional structure of ligands 5-[(naphthalen-2-yloxy) methyl]-1,3,4-oxadiaszole2-thiol (B3), diazepam (DZM), and flumazenil (FLZ), respectively drawn using Discovery Studio Visualizer 2016.](/cms/asset/d09be1e6-f66d-4336-a498-a0de284f52dc/djir_a_12190443_f0002_c.jpg)
Table 1 The Dog Site Scorer Value of the Target Protein Gamma Amino Butyric Acid a (GABAa) with Protein Data Band (PDB) ID: 6D6T. 1A Represents the First 3 Pockets P_0, P_1 and P_2 and Then Randomly Selected Three Pockets for Docking P_11, P_15 and P_17. 1B Represents the Size and Shape of Each Pocket (P_0, P_1 and P_2, P_11, P_15) with Respects to Its Volume, Surface Area, Depth, Ellipsoid Main Axis Ratio c/a, Ellipsoid Main Axis Ratio b/a, and Enclosure. 1C Represents the Elements of Each Pocket Including Pocket Atom, Carbon, Nitrogen, Oxygen, and Sulfur. 1D Represents the Functional Group of Each Pocket Involve in Bonding as Hydrogen Bond Donor, Acceptors, Metal, Hydrophobic Interactions, and Hydrophobicity Ratio. 1E Represents the Amino Acid Composition of Each Pocket Involved in Bonding as Apolar Amino Acid Ratio, Polar Amino Acid Ratio, Positive Amino Acid Ratio, and Negative Amino Acid Ratio. 1F Represents a Specific Amino Acid in a Given Pocket of the Target Involve in Bonding as Polar Amino Acid Ratio, Polar Amino Acid Ratio, Positive Amino Acid Ratio, and Negative Amino Acid Ratio
Figure 3 The active sites of gamma amino butyric acid (GABA) (P0, P1, P2, P11, P15 and p17) obtained through Dog site scorer.
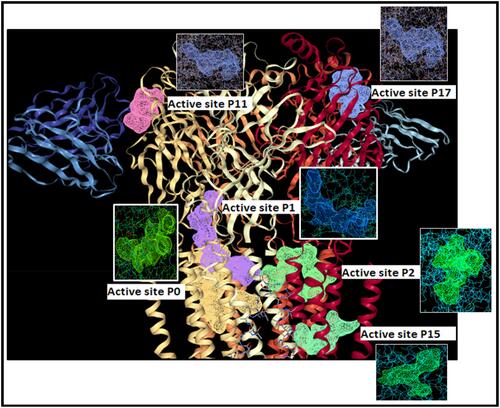
Figure 4 Part (A) represents the total residues, protein chain, atoms, heavy atoms, and charged atoms. Part (B) shows the mean root square fluctuation (RMSF) in angstrom (Å) of the target protein. Part (C) represents the protein secondary structure elements (SSE), alpha-helices shown in red, and beta-strands shown in blue monitored through simulation. The plot summarizes the SSE composition for each trajectory frame over the course of simulation.
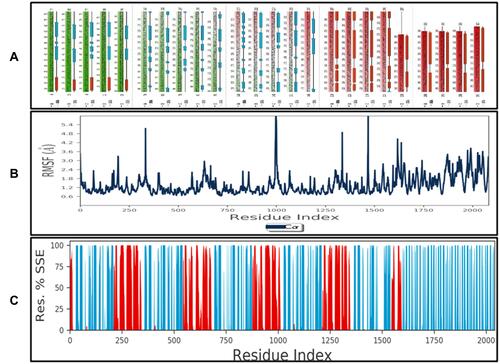
Figure 5 Parts (1), (2), and (3) represent ligands (5-[(naphthalen-2-yloxy) methyl]-1,3,4-oxadiaszole2-thiol [B3], diazepam [DZM], and flumazenil [FLZ]) root mean square deviation (RMSD) values, radius of gyrus (RG) value, intra molecular hydrogen bonds, molecular surface area (MSA), solvent accessible surface area (SASA), and polar surface area (PSA), respectively. Parts (A–C) represent the torsion region of each ligand B3, DZM and FLZ throughout the simulation shown in different colors. (A1-AC) represent rotatable bonds. Each rotatable bond torsion is complemented by a dial plot (A1–C1) and bar plots of the same color.
![Figure 5 Parts (1), (2), and (3) represent ligands (5-[(naphthalen-2-yloxy) methyl]-1,3,4-oxadiaszole2-thiol [B3], diazepam [DZM], and flumazenil [FLZ]) root mean square deviation (RMSD) values, radius of gyrus (RG) value, intra molecular hydrogen bonds, molecular surface area (MSA), solvent accessible surface area (SASA), and polar surface area (PSA), respectively. Parts (A–C) represent the torsion region of each ligand B3, DZM and FLZ throughout the simulation shown in different colors. (A1-AC) represent rotatable bonds. Each rotatable bond torsion is complemented by a dial plot (A1–C1) and bar plots of the same color.](/cms/asset/9680b6c3-99d4-4e9e-a785-6c29a124a6fc/djir_a_12190443_f0005_c.jpg)
Figure 6 (A–C) represent ligands (5-[(naphthalen-2-yloxy) methyl]-1,3,4-oxadiaszole2-thiol [B3], diazepam [DZM], and flumazenil [FLZ]) information in the form of number of atoms, atomic mass, charge, molecular formula, number of fragments and number of rotatable bonds.
![Figure 6 (A–C) represent ligands (5-[(naphthalen-2-yloxy) methyl]-1,3,4-oxadiaszole2-thiol [B3], diazepam [DZM], and flumazenil [FLZ]) information in the form of number of atoms, atomic mass, charge, molecular formula, number of fragments and number of rotatable bonds.](/cms/asset/c6cada8c-3b77-4e1e-a27f-e0555be071ec/djir_a_12190443_f0006_c.jpg)
Figure 7 Best pose of B3 (A), interactions of B3 (B) and two-dimensional representation of hydrogen bonds of B3 (C) drawn using Discovery Studio Visualizer 2016.
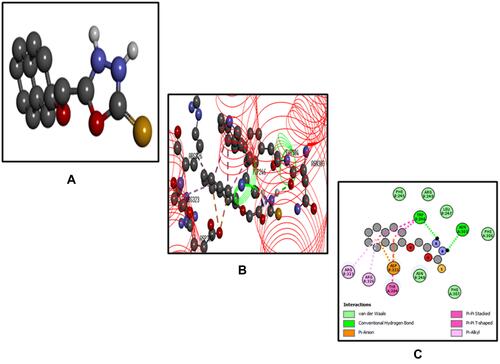
Table 2 Represent the Pharmacokinetics Profile of Ligand 5-[(naphthalen-2-yloxy) methyl]-1,3,4-oxadiaszole2-thiol (B3
Table 3 Binding Affinity (Kcal/mol) of Hydrogen Bonds, Amino Acid Residues Pi Alkyl Bonds, Van der Waals forces After Docking of 5-[(naphthalen-2-yloxy) methyl]-1,3,4-oxadiaszole2-thiol (B3), Diazepam (DZM), and Flumazenil (FLZ) Against Gamma Amino Butyric Acid (GABA)
Figure 8 Best pose of diazepam (DZM) (A), interactions of DZM (B) and two-dimensional representation of hydrogen bonds of DZM (C) drawn using Discovery Studio Visualizer 2016.
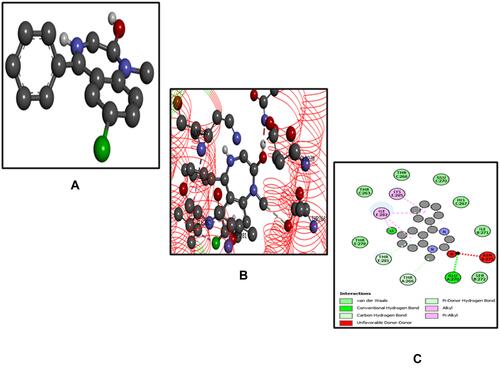
Figure 9 Best pose of flumazenil (FLZ) (A), interactions of FLZ (B) and two-dimensional representation of hydrogen bonds of FLZ (C) drawn using Discovery Studio Visualizer 2016.
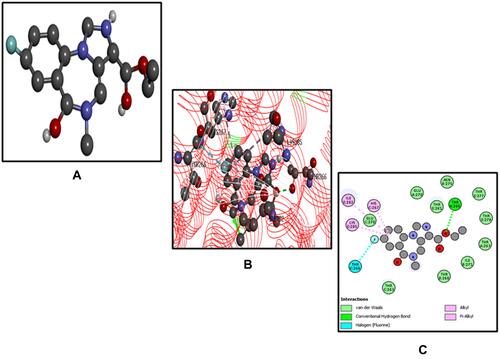
Figure 10 (A–C) represents the root mean square fluctuation (RMSF) of the atomic positions for the ligand 5-[(naphthalen-2-yloxy) methyl]-1,3,4-oxadiaszole2-thiol (B3), diazepam (DZM), and flumazenil (FLZ) using the Desmond package.
![Figure 10 (A–C) represents the root mean square fluctuation (RMSF) of the atomic positions for the ligand 5-[(naphthalen-2-yloxy) methyl]-1,3,4-oxadiaszole2-thiol (B3), diazepam (DZM), and flumazenil (FLZ) using the Desmond package.](/cms/asset/dab5bfdd-da52-4447-b20a-f195c9e8fee6/djir_a_12190443_f0010_c.jpg)
Figure 11 (A–C) represents root mean square deviation (RMSD) for protein GABA (6D6T) shown in blue and RMSD of ligands including 5-[(naphthalen-2-yloxy) methyl]-1,3,4-oxadiaszole2-thiol (B3), diazepam (DZM) and flumazenil (FLZ) as shown in red using the Desmond software package.
![Figure 11 (A–C) represents root mean square deviation (RMSD) for protein GABA (6D6T) shown in blue and RMSD of ligands including 5-[(naphthalen-2-yloxy) methyl]-1,3,4-oxadiaszole2-thiol (B3), diazepam (DZM) and flumazenil (FLZ) as shown in red using the Desmond software package.](/cms/asset/b4fc58a3-058e-45ea-87b8-bd31399f9c6a/djir_a_12190443_f0011_c.jpg)
Figure 12 A timeline representation of the interactions and contacts (hydrogen bonds, hydrophobic, ionic, and water bridges) are displayed in (A1–A3). The top-panel displays the total count of the specific contacts of the protein with the ligand. The bottom-panel shows the interacting residues with the ligand. Some residues form more than one specific contact with the ligand, denoted by a darker-shade of Orange, according to the scale to the right of the plot. Protein interactions with the ligand are shown in (B1–B3). These interactions are categorized as hydrogen bonds, hydrophobic, ionic, and water bridges. Schematic detail of the ligand–atom interactions with the protein residues. Interactions that occurred more than 30% of the simulation time are shown in (C1–C3).
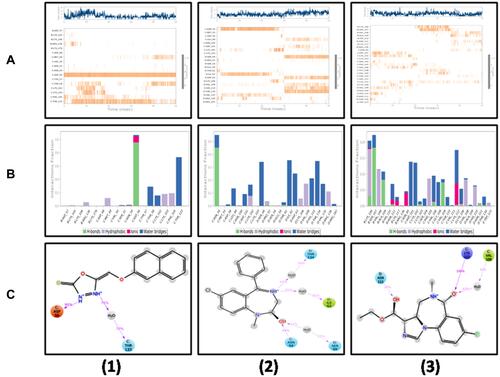
Table 4 Effect of 1,3,4 Oxadiazole Derivative (B3) on Phenyltetrazole (PTZ)-Induced Seizure in Mice. Data are Showed as Mean ± Standard Error of Mean (SEM) (n = 6). **P < 0.01 vs PTZ Group, One-Way Analysis of Variance (ANOVA) and Post Hoc Tukey’s Test
Table 5 Effect of Flumazenil on Anticonvulsant Effect of 1,3,4 Oxadiazole Derivative (B3) in Phenyltetrazole (PTZ)-Induced Seizure in the Presence of Flumazenil in Mice. Data are Showed as Mean ± Standard Error of Mean (SEM) (N = 6). **P < 0.01 and***P < 0.001 vs PTZ Group, One-Way Analysis of Variance (ANOVA) and Post Hoc Tukey’s Test
Table 6 Express Effects of 5-[(naphthalen-2-yloxy) methyl]-1,3,4-oxadiaszole2-thiol (B3) on Oxidative Enzymes of the Brain Cortex in Acute Epileptic Model. Data are Showed as Mean± Standard Error of Mean (SEM) (n = 6).).*P < 0.05,**P < 0.01 and***P < 0.001 vs PTZ Group, One-Way Analysis of Variance (ANOVA) and Post Hoc Tukey’s Test
Figure 13 Representative Immuno-histochemical images of hematoxylin, eosin (H and E) and quantified histogram of survival neuron reactivity and integrated density in cortex.
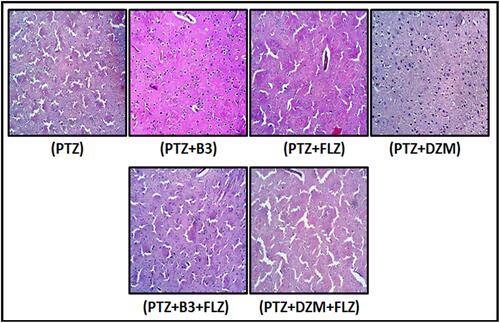
Figure 14 Immunohistochemical results of tumor necrosis factor (TNF)-α in the cortex of mice. Bar 20µm, magnification 40 ×. Histograms present a comparatively higher expression of TNF-α in the PTZ-induced seizure group ***P < 0.001 present significant difference compared to the phenyltetrazole (PTZ)-group. Data are expressed as mean ± standard error of mean (SEM) and analyzed by one-way analysis of variance (ANOVA), followed by post-hoc Tukey’s test in Graph Pad Prism. The p value was calculated using Graph Pad Instate.
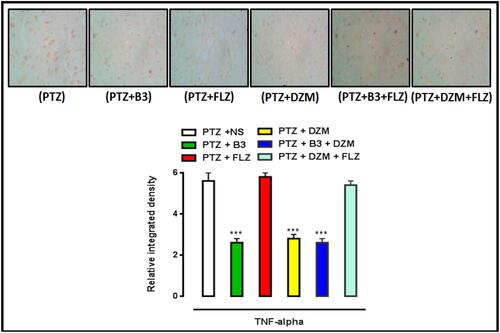
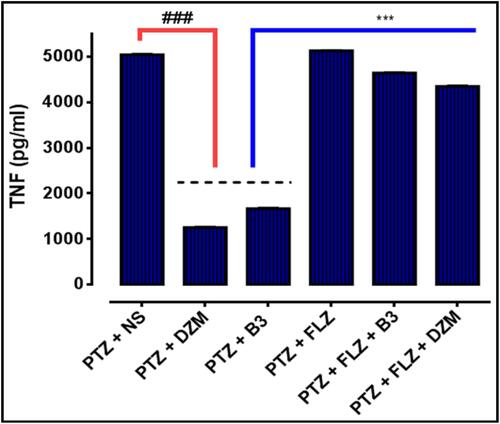
Figure 15 Protein expression of TNF-α, quantified by using enzyme linked immunosorbent assay. (ELISA). The data are shown as mean ± standard error of mean (SEM). ***P<0.001 indicates significant difference vs treatment group and ###P <0.001 shows significant difference vs PTZ. Data were analyzed by using one way analysis of variance (ANOVA), followed by post-hoc Tukey’s test in Graph Pad Prism. The P value was calculated using Graph Pad Instate.