
Figures & data
Table 1 The Base Information of Patients with B-NHL in This Study
Table 2 The Distribution of NLRP3 Genetic Polymorphisms and Their Association with B-NHL Susceptibility
Table 3 The Distribution of NLRP3 Genetic Polymorphisms and Their Association with DLBCL and FL Susceptibility
Table 4 The Distribution of NLRP3 Alleles and Their Association with B-NHL Susceptibility
Table 5 The Distribution of NLRP3 Genetic Polymorphisms and Their Association with Clinical Features of B-NHL
Figure 1 Kaplan-Meier curves of IL-18 (rs1946518), IL-1β (rs16944), CARD8 (rs2043211) NFκB-94 ins/del ATTG genotypes and LDH in patients with B-NHL. Log-rank P values compared with the different genotypes are shown, and CARD8 (rs2043211) AA genotype and higher LDH contributed to poorer B-NHL survival.
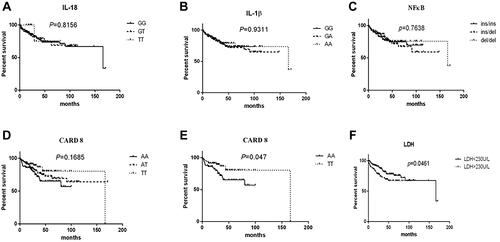
Table 6 Cox Regression Analysis for Survival of Patients with B-NHL