
Figures & data
Table 1 Pretreatment Patient and Disease Characteristics
Figure 1 Receiver operating characteristic curve analyses outcomes per pretreatment CA 19-9 and systemic inflammation response index measures: (A) CA 19-9 and progression-free survival, (B) CA 19-9 and overall survival, (C) Systemic inflammation response index and progression-free survival, and (D) Systemic inflammation response index and overall survival.
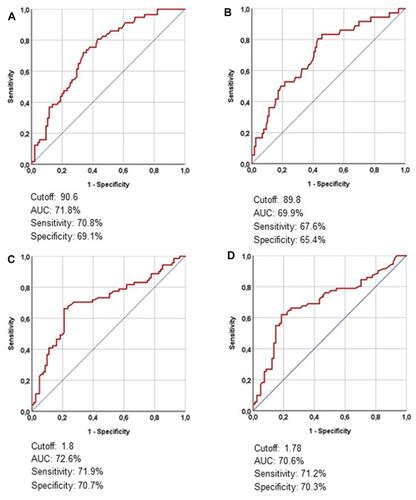
Table 2 Definition of Blended CA 19–9 and Systemic Inflammation Response Index Groups, and Pancreas Cancer Prognostic Index
Table 3 Survival Outcomes per Blended CA 19-9 and Systemic Inflammation Response Index Groups
Table 4 Survival Outcomes per Pancreatic Cancer Prognostic Index Groups
Figure 2 Survival outcomes per pancreas cancer prognostic index (PCPI) groups: (A) Progression-free survival, and (B) Overall survival (Red line: PCPI-1; Dark blue line: PCPI-2; and Dark green line: PCPI-3).
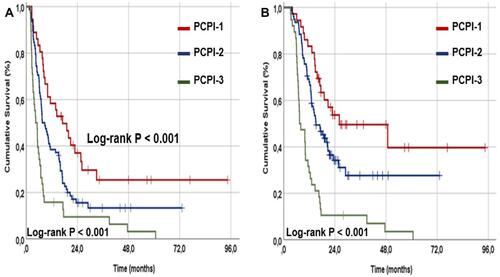
Table 5 Results of Uni- and Multivariate Analyses
Table 6 Survival Outcomes per Factors Showing Independent Prognostic Significance in Multivariate Analyses