Figures & data
Figure 1 Selection process of subjects.
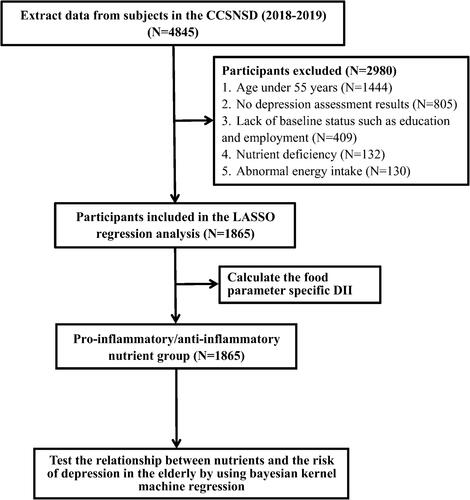
Table 1 Baseline Characteristics of the 1865 Subjects [Median(IQR) or Frequency(%)]
Table 2 Nutrient Content of Study Participants
Figure 2 Factor selection using the LASSO logistic regression model. (A) LASSO coefficients of 22 candidate variables. (B) Identification of the optimal penalization coefficient (λ) in the LASSO model was achieved by 10-fold cross-validation and the minimum criterion. The left vertical line represents the minimum error, and the right vertical line represents the cross-validated error within 1 standard error of the minimum.
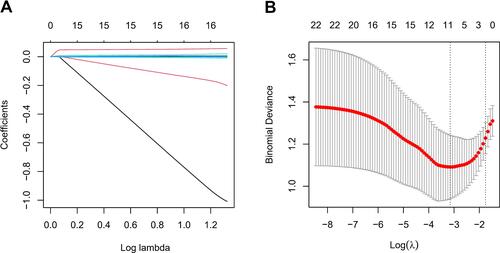
Table 3 Food Parameter Specific DII Score
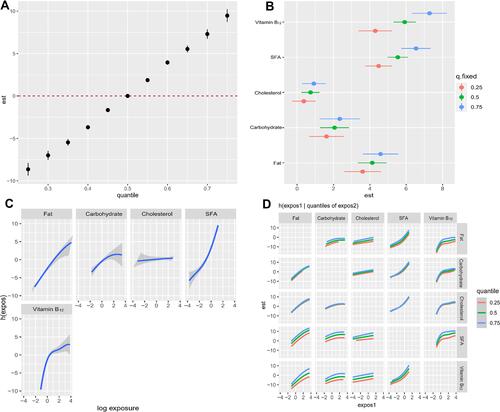
Figure 3 Associations between dietary pro-inflammatory nutrients and depression among the study population by BKMR model. The model is based on age, gender, education level, body mass index, employment status, smoking status, drinking status, daily energy intake, hypertension and diabetes, and other nutrients. (A) Cumulative effects of dietary pro-inflammatory nutrients (estimated value and 95% confidence interval). Compared with other nutrients in the 50th percentile, the nutrients are in a specific percentile (X-axis). (B) The single-nutrient effect (estimates and 95% credible intervals). (C) The univariate nutrient response function of each dietary pro-inflammatory nutrient has a 95% confidence band, and the other nutrients are fixed at the median. (D) Bivariate exposure response function of each two pro-inflammatory nutrients in depression.
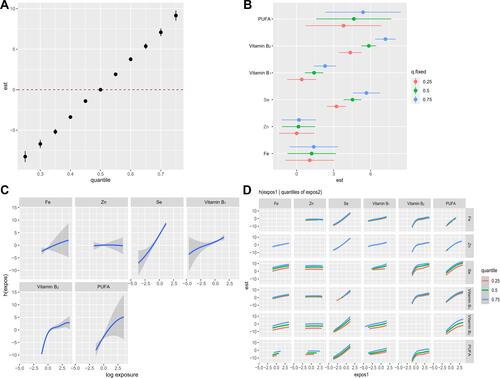
Figure 4 Associations between dietary anti-inflammatory nutrients and depression among the study population by BKMR model. The model is based on age, gender, education level, body mass index, employment status, smoking status, drinking status, daily energy intake, hypertension and diabetes, and other nutrients. (A) Cumulative effects of dietary anti-inflammatory nutrients (estimated value and 95% confidence interval). Compared with other nutrients in the 50th percentile, the nutrients are in a specific percentile (X-axis). (B) The single-nutrient effect (estimates and 95% credible intervals). (C) The univariate nutrient response function of each dietary anti-inflammatory nutrient has a 95% confidence band, and the other nutrients are fixed at the median. (D) Bivariate exposure response function of each two anti-inflammatory nutrients in depression.