Figures & data
Table 1 Effect of Curcumae on the Development of Hepatic Nodules of DEN-Induced HCC Rats
Figure 1 Hepatic nodules of different group of rats. (A) DEN control, (B) DEN + CU (2.5 mg/kg), (C) DEN + CU (5 mg/kg) and (D) DEN + CU (10 mg/kg). Normal control rats did not show any sign of hepatic nodule.
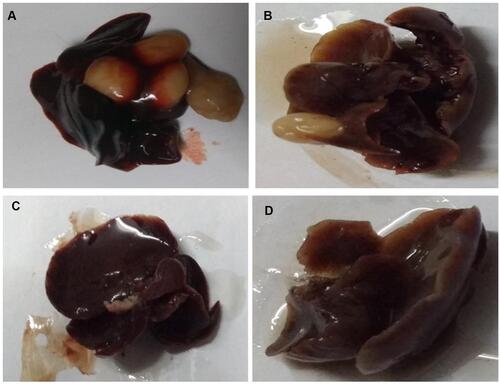
Table 2 Effect of Curcumae Against DEN-Induced HCC Rats
Figure 2 Effect of curcumae on the body weight and liver weight of obesity-induced hepatocellular carcinoma in rats. (A) Body weight and (B) liver weight. Tested group rats were compared with the DEN control group rats. *P<0.05, **P<0.01 and ***P<0.001 were considered as significant, more significant and extreme significant, respectively.
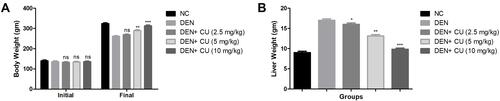
Figure 3 Effect of curcumae on the hepatic parameters of obesity-induced hepatocellular carcinoma in rats. (A) AFP, (B) AST, (C) ALT, (D) ALP and (E) ACP. Tested group rats were compared with the DEN control group rats. *P<0.05, **P<0.01 and ***P<0.001 were considered as significant, more significant and extreme significant, respectively.
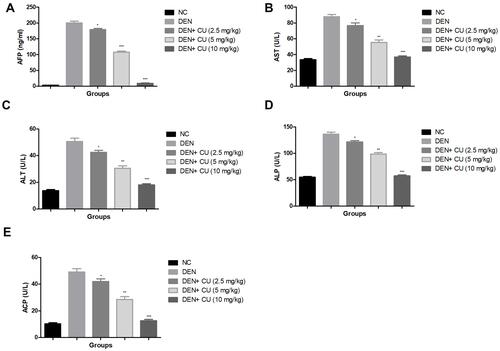
Figure 4 Effect of curcumae on the membrane-bound enzymes of obesity-induced hepatocellular carcinoma in rats. Tested group were compared with the DEN control group rats. *P<0.05, **P<0.01 and ***P<0.001 were considered as significant, more significant and extreme significant, respectively.
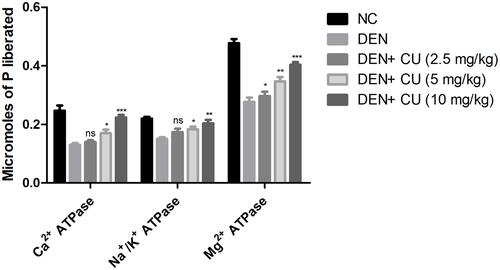
Figure 5 Effect of curcumae on the phase I and Phase II enzymes of obesity-induced hepatocellular carcinoma in rats. (A) NADPH cytochrome P450, (B) cytochrome P420, (C) NADPH cytochrome b5 and (D) cytochrome P5. Tested group rate were compared with the DEN control group rats. *P<0.05, **P<0.01 and ***P<0.001 were considered as significant, more significant and extreme significant, respectively.
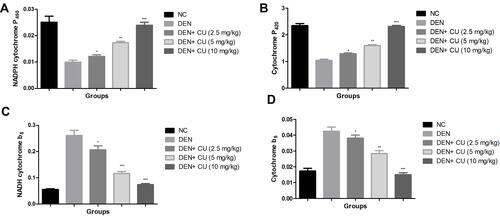
Figure 6 Effect of curcumae on the antioxidant parameters of obesity-induced hepatocellular carcinoma in rats. (A) MDA, (B) GPx, (C) p. carbonyl, (D) GST, (E) GSH, (F) MPO, (G) SOD and (H) CAT. Tested group rats were compared with the DEN control group rats. where *P<0.05, **P<0.01 and ***P<0.001 were considered as significant, more significant and extreme significant, respectively.
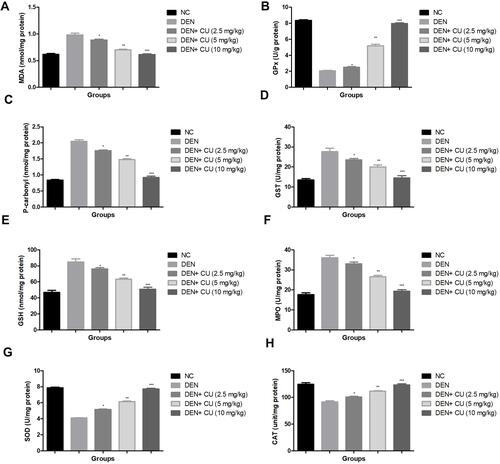
Figure 7 Effect of curcumae on the pro-inflammatory cytokines of obesity-induced hepatocellular carcinoma in rats. (A) TNF-α, (B) IL-1β, (C) IL-2, (D) IL-6, (E) IL-7 and (F) IL-10. Tested group rats were compared with the DEN control group rats. *P<0.05, **P<0.01 and ***P<0.001 were considered as significant, more significant and extreme significant, respectively.
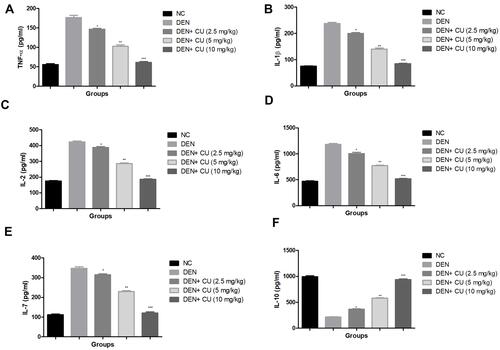
Figure 8 Effect of curcumae on the inflammatory parameters of obesity-induced hepatocellular carcinoma in rats. (A) COX-2 (serum), (B) PGE2 (serum), (C) COX-2 (liver tissue), (D) PGE2 (liver tissue). Tested group rats were compared with the DEN control group rats. *P<0.05, **P<0.01 and ***P<0.001 were considered as significant, more significant and extreme significant, respectively.
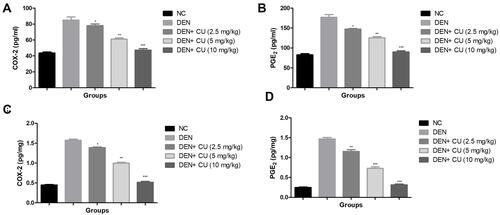
Figure 9 Effect of curcumae on the inflammatory parameters of obesity-induced hepatocellular carcinoma in rats. (A) NF-κB (serum) and (B) NF-κB (liver tissue). Tested group rats were compared with the DEN control group rats. *P<0.05, **P<0.01 and ***P<0.001 were considered as significant, more significant and extreme significant, respectively.
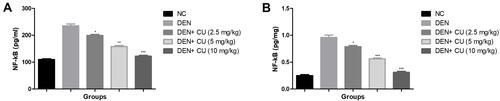
Figure 10 Effect of curcumae on the microbiota richness and distribution at genus, species and phylum level in obesity-induced hepatocellular carcinoma in rats. (A) relative abundance of major bacteria at phylum level, (B) relative abundance of major bacteria at genus level, (C) relative abundance of gram-negative or gram-positive bacteria, (D) Shannon index, (E) richness. Tested group rats were compared with the DEN control group rats. *P<0.05, **P<0.01 and ***P<0.001 were considered as significant, more significant and extreme significant, respectively.
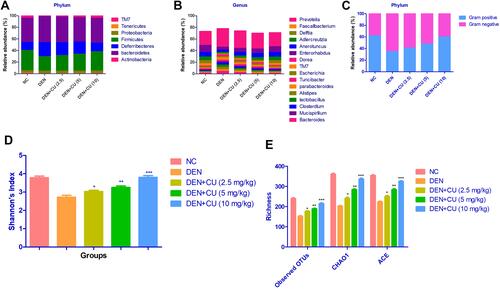
Figure 11 Effect of curcumae on the relative abundance of major bacteria at species level in obesity-induced hepatocellular carcinoma in rats. Tested group rats were compared with the DEN control group rats.
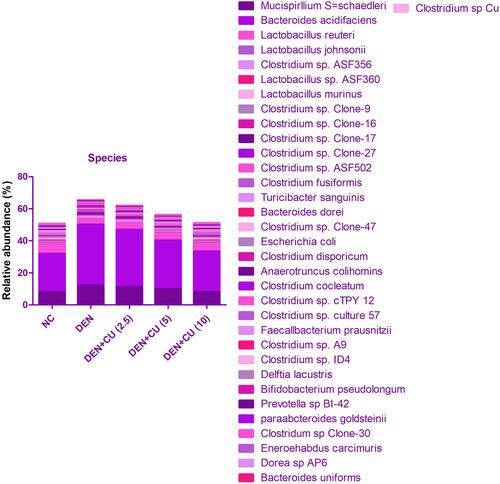
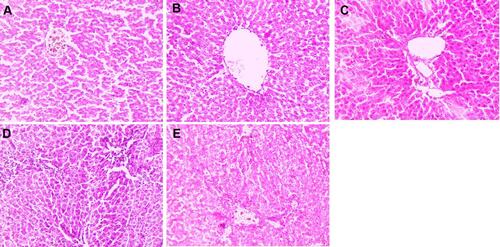
Figure 12 Effect of curcumae on the histopathology of obesity-induced hepatocellular carcinoma in rats. (A) Normal control, (B) DEN, (C) DEN + CU (2.5 mg/kg), (D) DEN + CU (5 mg/kg) and (E) DEN + CU (10 mg/kg). Tested group rats were compared with the DEN control group rats.