Figures & data
Table 1 Clinical Characteristics and Marker Expression of the Studied Lesions
Figure 1 Immunohistochemical expression of XRCC1, CD4, FOXP3, PD-1, and PD-L1 in clinical samples of HPs, LGDs, HGDs, and CRCs (all images: original magnification, ×200). (A–D) PD-1 epithelial expression in infiltrating lymphocytes. (E–H) PD-L1 epithelial expression in infiltrating lymphocytes. (I–L) CD4-positive intraepithelial lymphocyte density. (M–P) FOXP3-positive intraepithelial lymphocyte density. (Q–T) XRCC1 nuclei expression in colonic epithelial cells and tumor cells.
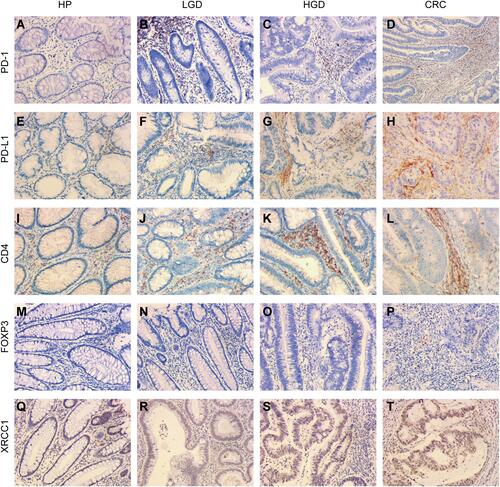
Table 2 Relationship of XRCC1 Expression with Immune Marker Expression and IELs of the Studied Lesions
Table 3 Association Between Predictor Variables and Colorectal Cancer (CRC) Determined via Bivariate and Multivariate Logistics Regression Analysis
Table 4 Immune Marker Expression and IELs in Colorectal Cancer (CRC) and Adenomas Based on the XRCC1 Gene Mutation Status
Figure 2 Correlation of XRCC1 expression with the survival and clinicopathological characteristics in TCGA-COAD cohort. (A) XRCC1 expression in COAD and normal tissues based on TCGA database. (B) Paired XRCC1 expression in COAD and normal tissues based on TCGA database. (C) Relationship of XRCC1 expression with survival in COAD patients. (D–I) Relationship of XRCC1 expression with clinicopathological characteristics (age, gender, tumor stage, and TNM) in COAD. The statistically significant (P value < 0.05).
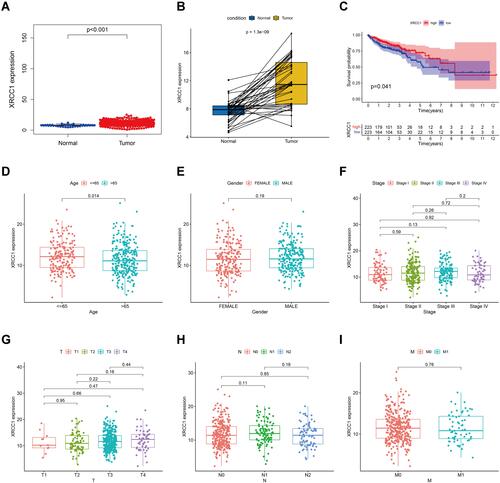
Figure 3 Mutation features of XRCC1 in TCGA-COAD cohort. (A) Alteration frequency of XRCC1 in pan-cancer data. (B) Alteration frequency of XRCC1 in different pathological types of COAD. (C) Alteration frequency of XRCC1 according to mutation type and the mutation site, with the 3D structure of XRCC1. (D–F) Relationship of XRCC1 mutation status with disease-free, progression-free, and overall survival in COAD patients. The statistically significant (P value < 0.05).
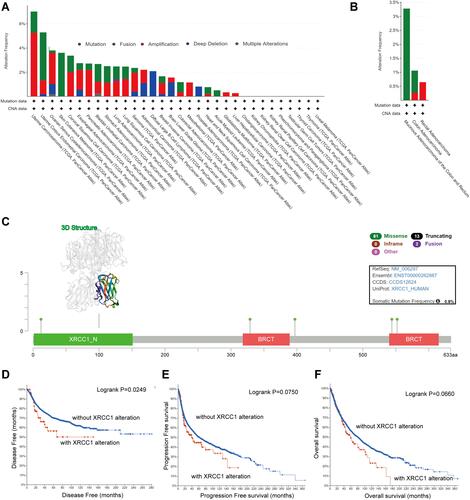
Figure 4 Correlation of TILs with XRCC1 expression based on TCGA-COAD cohort. (A) Violin plot showing the ratio differentiation of 22 types of immune cells between COAD tumor samples with high or low XRCC1 expression. (B) Scatter plot showing seven types of TILs correlated with XRCC1 expression. (C) Venn plot displaying five types of TILs correlated with XRCC1 expression co-determined via difference and correlation tests illustrated as violin and scatter plots, respectively. The statistically significant (P value < 0.05).
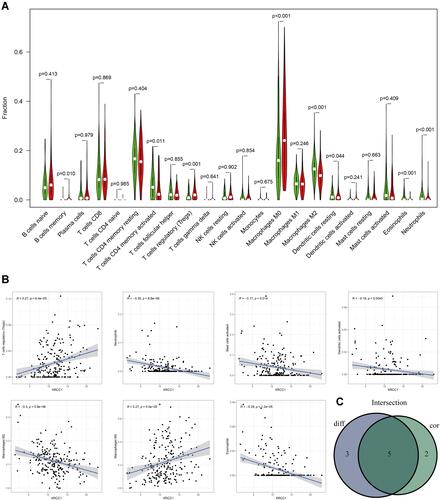
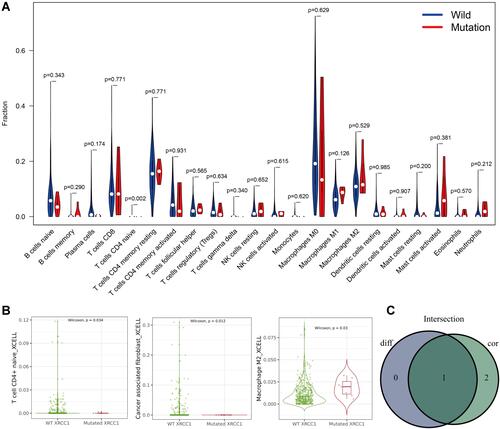
Figure 5 Correlations of TILs with XRCC1 mutation status based on TCGA-COAD cohort. (A) Violin plot showing the ratio differentiation of 22 types of immune cells between COAD tumor samples with XRCC1 wild or mutant status. (B) Scatter plot showing three types of TILs correlated with XRCC1 mutation status. (C) Venn plot displaying one type of TILs correlated with XRCC1 mutation status co-determined via difference and correlation tests illustrated as violin and scatter plots, respectively. The statistically significant (P value < 0.05).