Figures & data
Table 1 Demographic Data of Individuals Participating in the Study
Figure 1 Comparison of serum levels of angiopoietin (A) and endoglin (B) results between patients and control. Data are expressed as mean± standard error. Difference between patients and control was made using unpaired Student’s t-test for normally distributed data. *P <0.050.
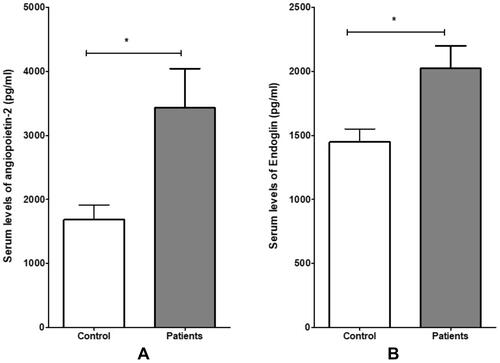
Figure 2 Comparison of serum levels of Endothelin-1 (A), VEGF-A (B) and G-CSF (C) results between patients and control. Data are expressed as mean± standard error. Difference between patients and control was made using unpaired Student’s t-test for normally distributed data. *P <0.050 and ***P <0.001.
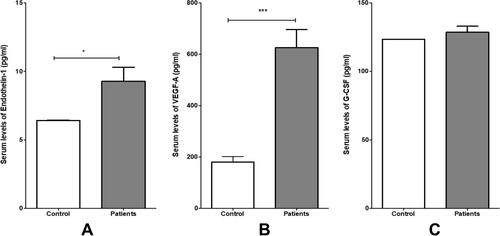
Figure 3 Correlations coefficient between serum levels of angiopoietin and endoglin patients (r= 0.722; P =0.001), and of angiopoietin and endothelin 1 in patients (r= 0.842; P =0.001) using Person test.
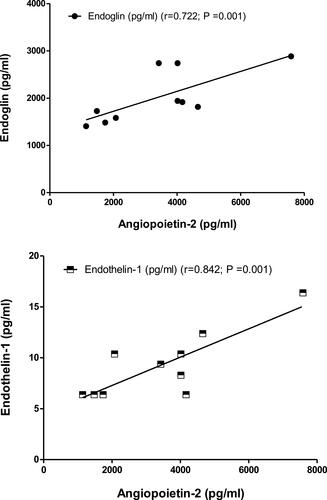
Figure 4 Correlations coefficient between serum levels of endoglin and endothelin 1 in patients (r= 0.631; P =0.004), and endoglin and VEGF in patients (r= 0.512; P =0.025) using Person test.
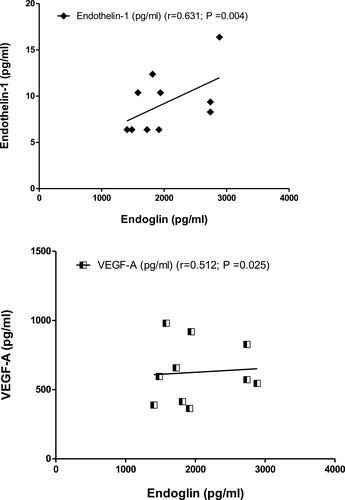
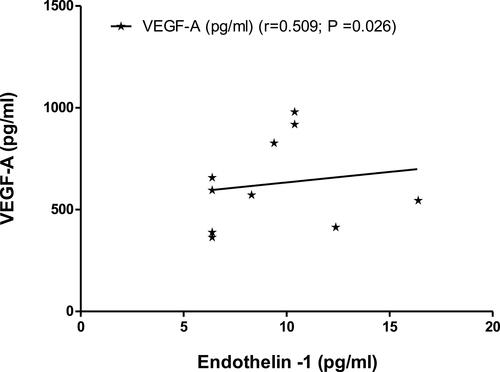
Figure 5 Correlations coefficient between serum levels of endothelin-1 and VEGF in patients (r= 0.509; P =0.026) using Person test.