Figures & data
Table 1 Sequences of Primers Used in This Study
Figure 1 Flavonoids in GPFE. The detection wavelength is 285 nm. (A) standard chromatograms; (B) flavonoids constituents of GPFE: 1. narirutin, 2. hesperidin, 3. nobiletin, 4. tangeretin, 5. 5-demethylnobiletin.
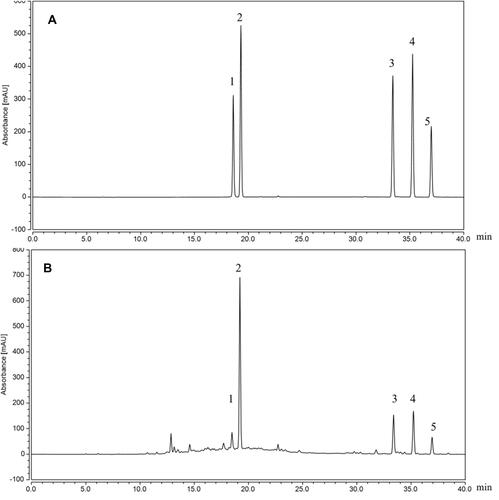
Figure 2 Histopathological observation of liver tissues sections in mice of the different groups after staining with hematoxylin and eosin (H&E).
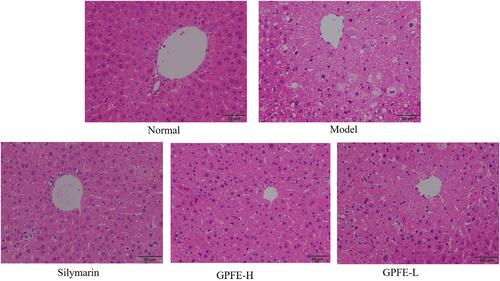
Table 2 The Liver Injury Degree in Mice
Table 3 Liver Tissue Levels of ALT, AST, SOD, CAT and MDA in Mice from Each Group
Table 4 Serum Levels of TNF-α, IL-1β, IL-6, and IFN-γ in Mice of Each Groups
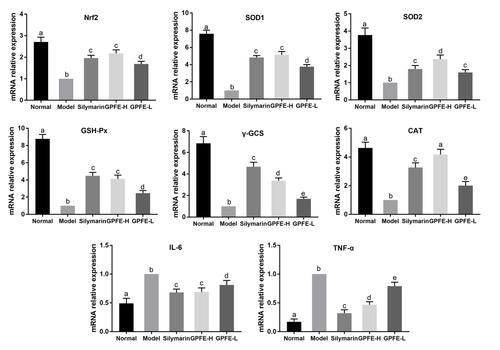
Figure 3 mRNA expression levels of SOD1, SOD2, CAT, γ-GCS, GSH-Px, Nrf2, IL-6 and TNF-α in liver tissues of the different groups were investigated by qPCR. The data are shown as mean ± SD (n = 8). a–eMean values with different letters are significant difference (p < 0.05) according to analysis of variance.