Figures & data
Figure 1 H2 concentration measurement. (A) H2 concentration in the liver of mice during inhalation of 4% H2 (n = 3), (B) H2 concentration in the liver of mice after inhalation of 4% H2 (n = 3), and (C) H2 concentration of HRW in drinking bottled water (n = 3). Data are presented as mean ± SD.
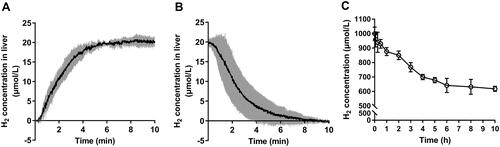
Table 1 Effects of H2 on Body Weight and Organ Index in Mice
Figure 2 Effects of H2 on aging-related biomarkers in plasma of D-gal-induced aging mice. (A) TAOC, (B) AGEs, (C) TNF-α, (D) FFA, and (E) ALT levels. Data are expressed as mean ± SD (n = 10). **P < 0.01, ***P < 0.001 compared with the Control group; #P < 0.05, ##P < 0.01, and ###P < 0.001 compared with the Model group.
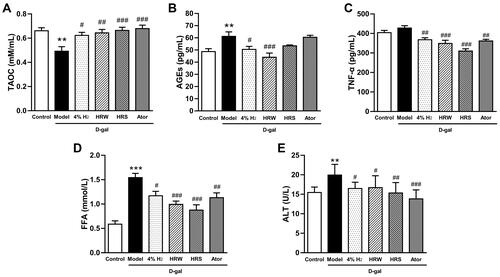
Figure 3 H2 alleviates oxidative stress in D-Gal-induced aging mice. LPO levels, MDA levels, and SOD activities in the liver (A–C), brain (D–F), and heart (G–I). Data are expressed as mean ± SD (n = 10). *P < 0.05, ***P < 0.001 compared with the Control group; #P < 0.05, ##P < 0.01, and ###P < 0.001 compared with the Model group.
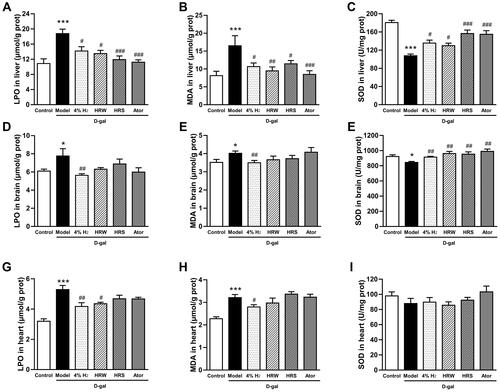
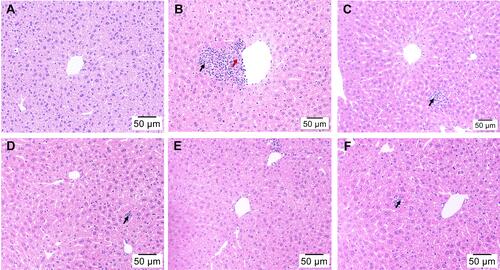
Figure 4 Effect of H2 on liver histopathological alterations in mice injured by D-Gal (H&E staining, magnification 200×). (A) Control group, (B) Model group, (C) 4% H2 group, (D) HRW group, (E) HRS group, and (F) Ator group. Black arrows indicate inflammatory cell infiltration and red arrow indicates necrosis.