Figures & data
Table 1 Clinicopathological Characteristics of the Patients Included in the Training Group and Validating Groups
Figure 1 The flow chart for constructing and verifying the 8-mRNA signature. Differentially expressed IFN-γresponse genes were screened from ccRCC samples and normal renal tissue samples from TCGA database. The samples included in the following study were randomly divided into training group and testing group at a ratio of 1:1. Univariate Cox regression, LASSO and multivariate Cox regression were used for the training group to construct the 8-mRNA signature for the training group. And the testing group was used to test the stability of the model.
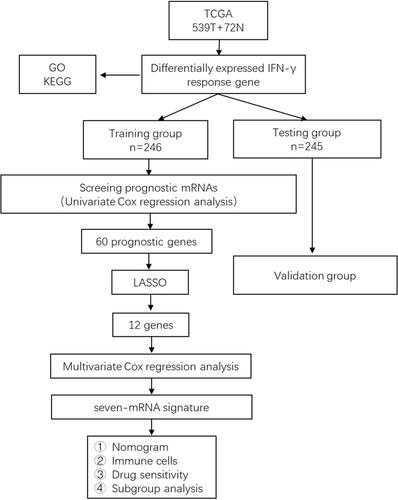
Figure 2 Heatmaps, volcano maps and functional enrichment analysis of differentially expressed IFN-γ response genes between normal tissue and ccRCC. (A) Heatmap demonstrating the 178 differentially expressed IFN-γ response genes. (B) volcano map demonstrating the 178 differentially expressed IFN-γ response genes. The green dots on the left represent the down-regulated genes, and the red dots on the right represent the up-regulated genes. (C) Gene Ontology (GO) analysis; BP, CC and MF represent biological process, cellular component and molecular function, respectively. (D) The most significant Kyoto Encyclopedia of Genes and Genomes (KEGG) pathway analyses.
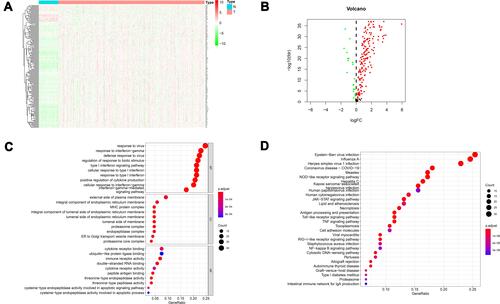
Table 2 7-Gene Signature Selected by Multivariate Cox Regression
Figure 3 LASSO regression. (A) The variation trajectory of each independent variable. The logarithm of the independent variable lambda was taken as the horizontal axis, and the coefficient of the independent variable was taken as the vertical axis. (B) Confidence intervals for each phase for each lambda, the vertical black dotted lines defined the optimal values of lambda, which provides the best fit.
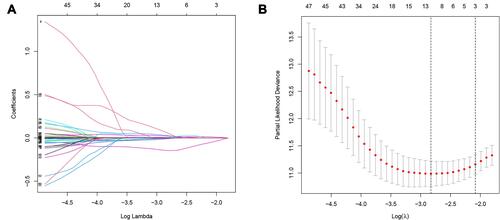
Figure 4 Identification and verification of survival-predicting signature. (A) The distribution of risk score, survival time and survival status of ccRCC patients in the training group. (B) Kaplan–Meier curves in the high- and low-risk groups of ccRCC patients in the training group. (C) The ROC curve over time in the training group. (D) The distribution of risk score, survival time and survival status of ccRCC patients in the testing group; (E) Kaplan–Meier curves in the high- and low-risk groups of ccRCC patients in the testing group; (F) The ROC curve over time in the testing group. P < 0.05 was considered as statistically significant.
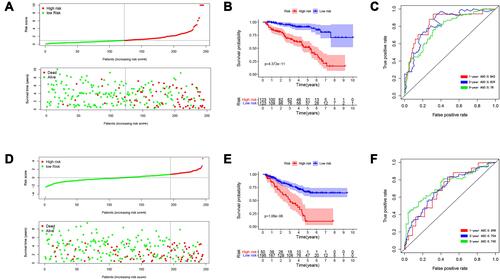
Figure 5 Subgroup analysis. The applicability of survival-predicting signature in different clinical characteristic groups (A) age ≥ 65; (B) age <65; (C) female; (D) male; (E) G1-2; (F) G3-4; (G) stage I–II and (H) stage III–IV). P < 0.05 was considered as statistically significant.
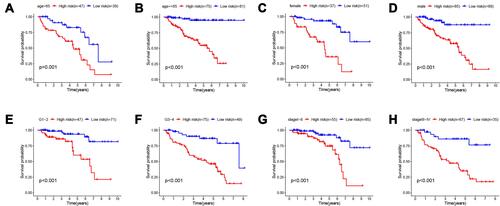
Table 3 Univariance and Multivariance Cox Regression Analysis of the Gene Signature
Figure 6 Establishment of the prognostic nomogram. (A) nomogram for predicting 1-year, 3-year and 5-year overall survival of ccRCC patients; (B) 1-year nomogram calibration curves of the prognostic nomogram; (C) 3-year nomogram calibration curves of the prognostic nomogram; (D) 5-year nomogram calibration curves of the prognostic nomogram.
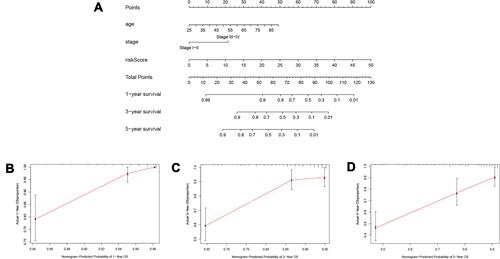
Figure 7 Immune infiltration landscapes in ccRCC. The left side red represents the expression in the high-risk group, the right side green represents the expression in the low-risk group. *P < 0.05; **P < 0.01; ***P < 0.001; -, not statistically significant.
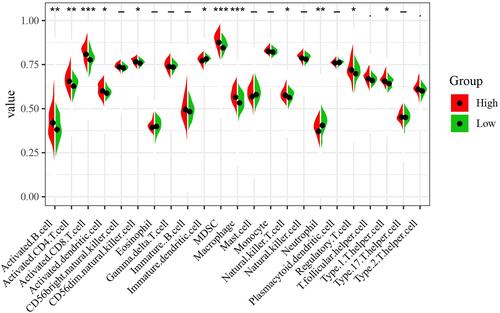
Figure 8 Comparing the efficiency of the selected drugs in high-risk group and low-risk group. Differences in the IC50 of six drugs in the high- and low-risk groups. (A) sorafenib; (B) sunitinib; (C) axitinib; (D) pazopanib; (E) cisplatin; (F) docetaxel. P < 0.05 was considered as statistically significant.
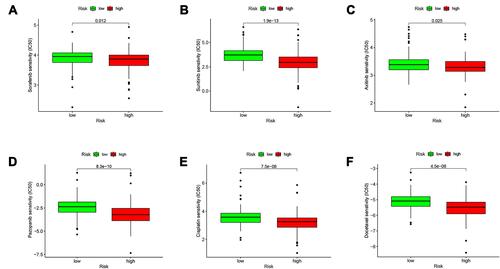
Figure 9 The powerful role of survival-predicting signature in immunotherapy. Differential expression of immune checkpoint genes in the high- and low-risk groups of the TCGA training group (Wilcox test, *P < 0.05; **P < 0.01; ***P < 0.001), The blue box on the left represents the low-risk group, and the red box on the right represents the high-risk group.
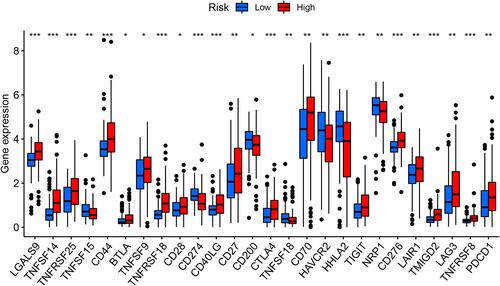
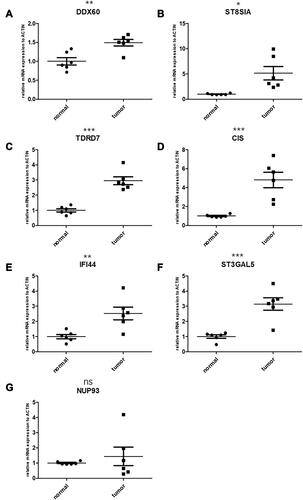
Table 4 The Primer of Seven Genes
Figure 10 Validation of candidate genes by qPCR. (A) DDX60, normal: 1.000±0.2391, tumor:1.490±0.2112; (B) ST8SIA4, normal:1.000± 0.1394, tumor: 5.148± 3.243; (C) TDRD7, normal: 1.000± 0.2638, tumor: 2.951± 0.6358; (D) C1S, normal: 1.000± 0.1457, tumor: 4.801 ± 1.994; (E) IFI44, normal: 1.000± 0.3412, tumor: 2.529± 1.017; (F) ST3GAL5, normal: 1.000± 0.2768, tumor: 3.148± 0.9999; (G) NUP93, normal: 1.000± 0.2391, tumor: 1.490± 0.2112. The left side represents the expression in the normal tissue, the right side represents the expression in the cancer tissue. *P < 0.05; **P < 0.01; ***P < 0.001; ns, not statistically significant.