Figures & data
Figure 1 Work flow diagram of data preparation, processing, analysis, and validation in this study.
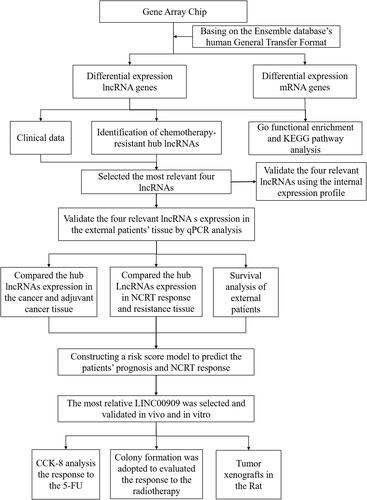
Figure 2 LncRNAs expression comparison between NCRT-resistant and NCRT-sensitivity groups. Gene Ontology (GO) functional and Kyoto encyclopedia of genes and genomes (KEGG) pathway analysis of the differentially expressed lncRNAs. (A) The hierarchical clustering of all targets values of differentially lncRNA expression among samples. (B) The heat map of the principal component analysis in each sample. (C) GO functional analysis in the differentially lncRNA revealed the top ten functional classifications. (D) KEGG pathway analysis in the differentially lncRNA revealed the top ten significant pathways. (E) The ceRNA network was constructed basing on the differential lncRNAs between NCRT resistance and NCRT response. (F) LASSO coefficient profiles of the 29 factors, (G) The AUC was estimated with cross-validation technique and the largest lambda value was chosen when the cross-validation error was within one standard error of the minimum.
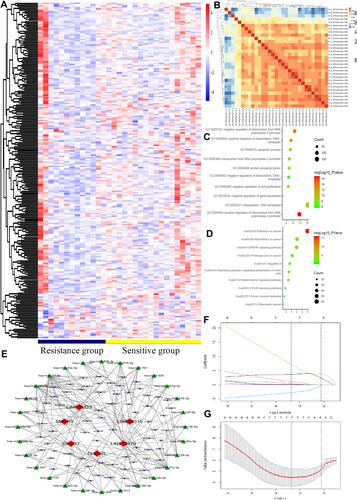
Figure 3 The hub lncRNAs validation and GO functional and KEGG pathway analysis in the 31 LARC patients’ gene microarray. (A) In the 31 LARC patients’ gene microarray the hub lncRNAs expression (all P<0.01). (B–E) ROC curves and AUC analysis to evaluate the predictive efficiency of the hub LncRNAs in 31 LARC patients’ gene microarray data. (F) GO functional analysis and KEGG pathway analysis (G) The network was constructed basing on the differential lncRNAs and mRNAs.
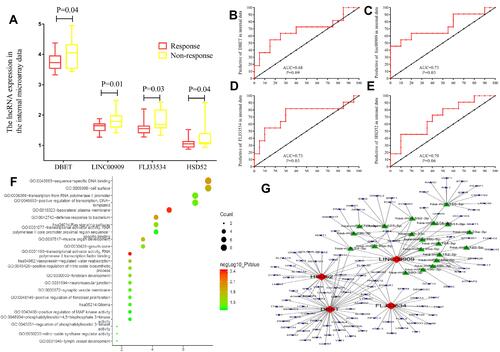
Figure 4 External validation of hub lncRNAs in cancer and adjuvant cancer tissue, and survival analysis. (A) The hub lncRNAs ΔCt values in the cancerous and adjacent non-cancer tissue in 138 CRC patients by qPCR (all P<0.01). (B) The heatmap of the ΔCt values. (C–F) The K-M analysis of the hub lncRNAs for the DFS in the 138 CRC patients. (G–J) The K-M analysis of the hub lncRNAs for the OS in the 138 CRC patients.
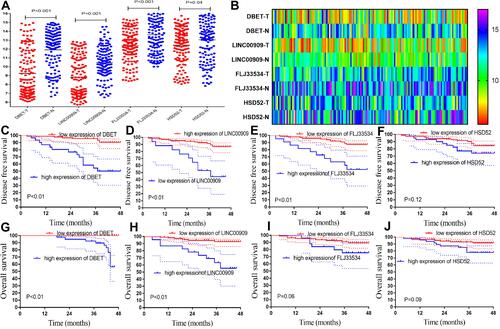
Figure 5 The hub lncRNAs validation in the 58 LARC patients following NCRT. (A) The hub lncRNAs expression values in the 58 LARC patients following NCRT. (B–E) ROC curves and AUC analysis to evaluate the predictive efficiency of the hub LncRNAs in the 58LARC patients following NCRT. (F–I) The K-M analysis of the hub lncRNAs for the DFS in the58LARC patients following NCRT. (J–M) The K-M analysis of the hub lncRNAs for the OS in the 58 LARC patients following NCRT.
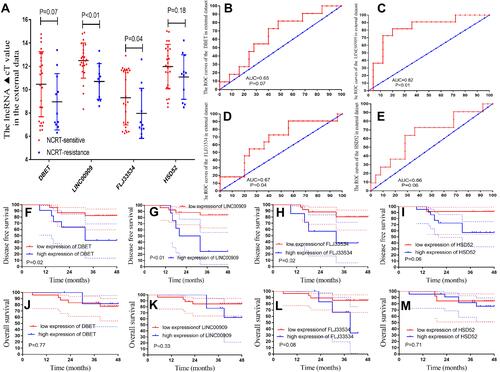
Figure 6 Risk factor model construction and verified in the prognosis and NCRT response. (A) The risk factor model of the hub lncRNAs in the 138 CRC patients. (Upper) LncRNA risk score distribution of 138 CRC patients. (Middle) Status of every patient in the external dataset (N=138). (Lower) Expression heatmap of the hub lncRNAs corresponding to each sample above. Red: high expression; Blue: low expression. (B) The OS analysis of the risk score in the 138 CRC patients. (C) The DFS analysis of the risk score in the 138 CRC patients. (D) The OS analysis of the risk score in the 58 LARC following NCRT patients. (E) The DFS analysis of the risk score in the 58 LARC following NCRT patients. (F) Time-dependent AUC curves of the hub lncRNAs and risk factor models for the prediction of DFS in the 138 CRC patients. (G) ROC curves and AUC analysis to evaluate the predictive efficiency of the risk score in the 58 LARC following NCRT patients.
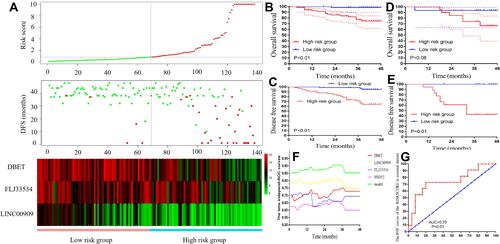
Table 1 Cox Regression Analysis of Predictive Factors for Overall Survival in CRC Patients (n = 138)
Table 2 Cox Regression Analysis of Predictive Factors for Disease-Free Survival in CRC Patients (n = 138)
Figure 7 The application value of the lncRNAs in the colorectal cancer patients. (A) The OS analysis of the risk score in the pathology stage I–II CRC patients. (B) The DFS analysis of the risk score in the pathology stage I–II CRC patients. (C) The OS analysis of the risk score in the pathology stage III–IV CRC patients. (D) The DFS analysis of the risk score in the pathology stage III–IV CRC patients. (E) Decision curve analysis for disease recurrence in the 138 CRC patients. (F) Clinical impact curve for the risk score in the 138 CRC patients. Of 1000 patients, the red solid line shows the total number of patients deemed to be at high risk for each risk threshold. The blue dashed line shows how many of those would be true positives.
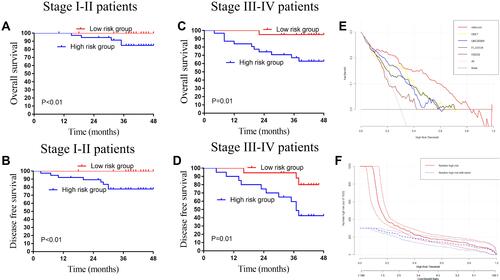
Figure 8 Verified the three lncRNAs in the R2 platform and Oncomine database. High expression of the DBET, LINC00909, and FLJ33534 were associated with worse prognosis in the TCGA, Sveen, and Marisa datasets in the R2 platform (all P < 0.05). Moreover, the DBET, LINC00909, and FLJ33534 were higher expression in the CRC cancer tissues compared with adjutant-cancerous tissues by eight datasets meat-analysis in Oncomine database.
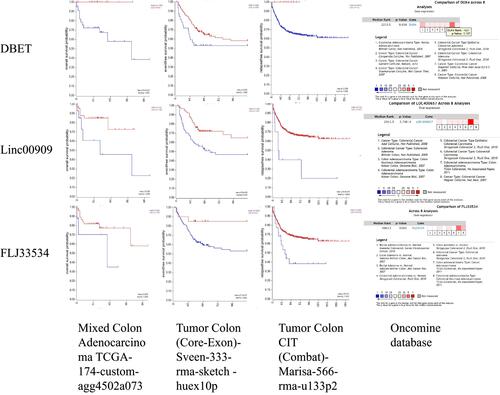
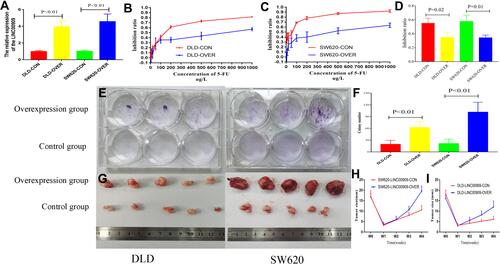
Figure 9 Overexpression of LINC00909 enhanced the resistance to the NCRT in vivo and in vitro. (A) LINC00909 expression was increased in overexpression group (P < 0.01). (B and C) CCK-8 assays revealed that significantly enhanced the resistance to the 5-FU in overexpression LINC00909 group compared with control group. (D) CCK-8 assays revealed that significantly enhanced the resistance to the 5-FU combined with 4Gy in overexpression LINC00909 group compared with control group. (E and F) Colony formation assays demonstrated significantly increased cell number in overexpression LINC00909 cell lines, compared to control cells. (G) Representative tumor images of control and overexpression LINC00909 in SW620 and DLD cells. (H and I) Tumor growth curves of SW620 and DLD xenografts from the overexpressed LINC00909 and control groups.