Figures & data
Table 1 Demographic, Clinical and Biochemical Characteristics of the Investigated Patients and Controls
Figure 1 Comparison of the functional pathways altered in the blood of AD patients vs controls. Dysregulated genes were averaged from those reported in GSE63060 and GSE63061 microarray data after GEOR2 analysis. The functional annotation corresponding to biological processes (GOTERM_BP_DIRECT) was analyzed using the DAVID database.Citation37 Significant associations (adjusted p-value (FDR/BH) <0.05) are plotted against the enrichment score.
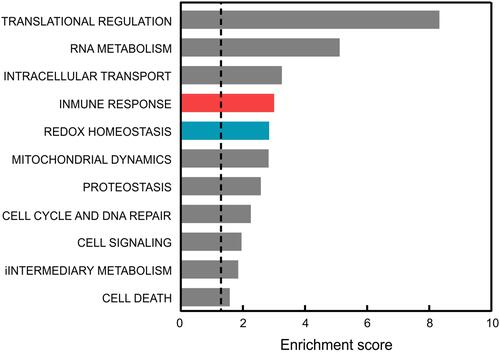
Figure 2 Disease-specific markers in the group of mild AD patients. (A) Evolution of the MMSE score. Patients were recruited during the first visit to the neurologist (0 time point), before starting specific AD medication. Results are expressed as mean ± SD. N is the number of patients tested for MMSE at consecutive yearly visits. *p<0.001 denotes statistically significant difference vs visit 0 (Pairwise Wilcoxon signed-rank test). (B) TAU, phosphoTAU (p-TAUT181) and Aβ(1–42) levels in CSF. Expected normal values are as follows: TAU, 212±122 pg/mL [47]; p-TAUT181 <60 pg/mL;Citation46 Aβ(1–42), 979±419 pg/mLCitation47. (C) Total TAU, Aβ(1–40) and Aβ(1–42) levels in plasma. Expected normal values are as follows: TAU, 74±076 pg/mL,Citation48 Aβ(1–40), 272±52 pg/mL,Citation49 Aβ(1–42), 39.7±10.5 pg/mLCitation49. For B and C, values are expressed as mean ± SEM.
![Figure 2 Disease-specific markers in the group of mild AD patients. (A) Evolution of the MMSE score. Patients were recruited during the first visit to the neurologist (0 time point), before starting specific AD medication. Results are expressed as mean ± SD. N is the number of patients tested for MMSE at consecutive yearly visits. *p<0.001 denotes statistically significant difference vs visit 0 (Pairwise Wilcoxon signed-rank test). (B) TAU, phosphoTAU (p-TAUT181) and Aβ(1–42) levels in CSF. Expected normal values are as follows: TAU, 212±122 pg/mL [47]; p-TAUT181 <60 pg/mL;Citation46 Aβ(1–42), 979±419 pg/mLCitation47. (C) Total TAU, Aβ(1–40) and Aβ(1–42) levels in plasma. Expected normal values are as follows: TAU, 74±076 pg/mL,Citation48 Aβ(1–40), 272±52 pg/mL,Citation49 Aβ(1–42), 39.7±10.5 pg/mLCitation49. For B and C, values are expressed as mean ± SEM.](/cms/asset/0229479d-4e3a-4332-b387-9c26b86890ad/djir_a_12190500_f0002_c.jpg)
Figure 3 Heat maps of individual gene expression data in the blood of mild AD patients and controls (CTRL). (A) Inflammatory genes. (B) Redox genes. Only genes with mean FC value >1.5 and p<0.01 in the AD group vs the control group are represented. Individual FC values for each gene were obtained by dividing the 2−ΔCt value of each subject to the mean 2−ΔCt value of the control group. Data were normalized and ordered in the heat map according to the average expression levels of all the considered genes, and were scaled considering the highest value as 100%. Heat maps of inflammation and redox genes with FC value<1.5 are presented in Supplementary Figures 1 and 2, respectively.
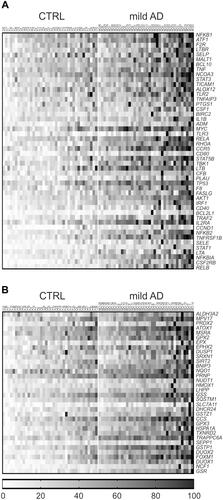
Table 2 Comparison of Genes Upregulated in the Blood of AD Patients (FC>1.5, p<0.01, ) and in Post-Mortem Samples of AD Brain from the GSE122063 Microarray Data Set
Figure 4 Transcription factors whose binding sites are enriched in the regulatory sequences of the genes with altered expression (FC>1.5 and p<0.05) comparing AD vs control subjects. (A) inflamatory genes from . (B) redox genes from . Identification of enriched transcription factors was done with the oPOSSUM software.Citation39 Fisher scores are plotted vs the GC composition of the TF profile. Dashed line represents one standard deviation above the mean. Transcription factor binding with scores higher than 1±SD are highlighted in colors as indicated.
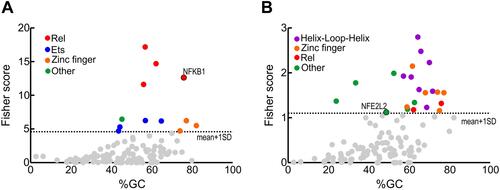
Figure 5 Inflammation genes with FC>2 and p<0.001, grouped according to their functional role. (A) Genes of the canonical and non-canonical NFκB pathway. (B) Genes involved in modulation of apoptosis. (C) Genes of the interferon and other inflammatory signalling pathways. (D) Genes that participate in coagulation. Mean FC values and SEM for each individual gene in AD patients and controls are also represented, as well as outlier values.
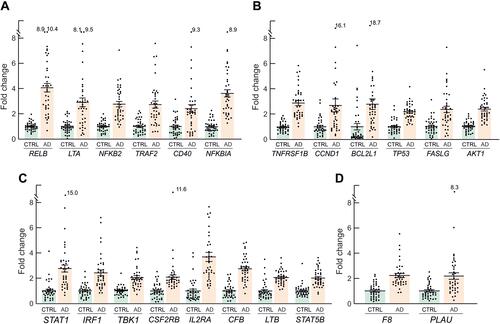
Figure 6 Redox genes with FC>2 and p<0.001, grouped according to their functional role. (A) Genes of the NADPH oxidase family, involved in ROS production. (B) Genes of glutathione and thioredoxin pathways. (C) Other genes involved in redox metabolism. Mean FC values and SEM for each individual gene in AD patients and controls are also represented, as well as outlier values.
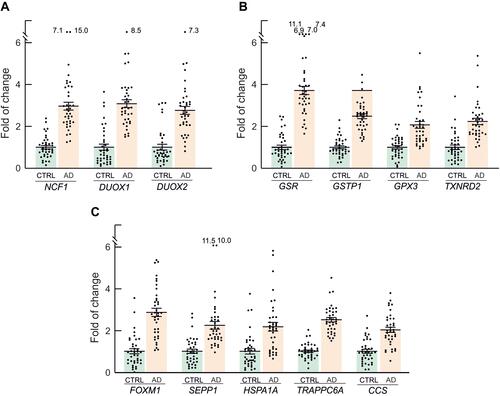
Figure 7 Receiver operating curve (ROC) analysis of the inflammation and redox genes that were significantly overexpressed (FC>2) in the group of AD patients vs controls, and exhibit area under the curve (AUC) values ≥ 0.9. A, inflammatory genes. B, redox genes.
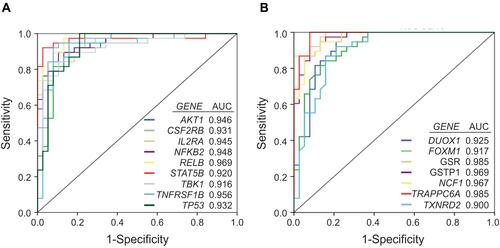
Figure 8 Principal component analysis for the expression level of the 19 inflammatory and redox genes selected from the ROC analysis (). Green dots, control subjects; orange dots, AD patients. X and Y axis show principal component 1 (PCA1) and principal component 2 (PCA2) that explain 66.7% and 8.7% of the total variance, respectively.
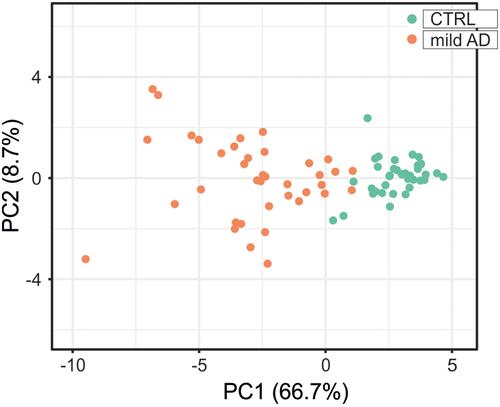
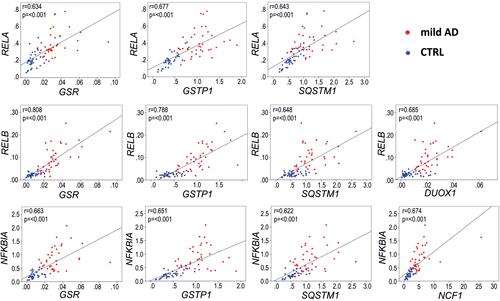
Figure 9 Representative Pearson correlations between inflammation and redox genes in the blood of AD patients.with the most significantly overexpressed (FC>3, p<0.001, and AUC>0.9) inflammation and redox genes. Note the high correlation in expression between the inflammation-related genes RELB and NFKB1A, regulated by transcription factor RELA, and three redox genes, GSR, GSTP1 and SQSTM1, regulated by the transcription factor NRF2. Blue dots, control group; red dots, AD group. Gene expression data are presented as 2−∆Ct values.