Figures & data
Figure 1 Aged IRF3-KO mice were protected from sepsis. Aged WT and IRF3-KO mice were subject to CLP to induce sepsis, and a second group of aged WT mice was subject to sham surgery as a control. Graphs show pooled male and female data (n=10/group CLP, n=5/group sham) for (A) animal survival, (B) disease score (degree of lethargy) and (C) surface temperature, indicative of hypothermia. This cohort was split into male and female subgroups to show the impact of biological sex. Graphs show data for the male mice (n=5/group CLP, n=3/group sham) including: (D) animal survival, (E) disease score (degree of lethargy) and (F) surface temperature; and the female mice (n=5/group CLP, n=2/group sham), including: (G) animal survival, (H) disease score (degree of lethargy) and (I) surface temperature. P values show the results of a log rank test comparing the WT and IRF3-KO CLP groups for animal survival and two-way repeated measures ANOVA comparing the WT and IRF3-KO CLP groups for the other measurements.
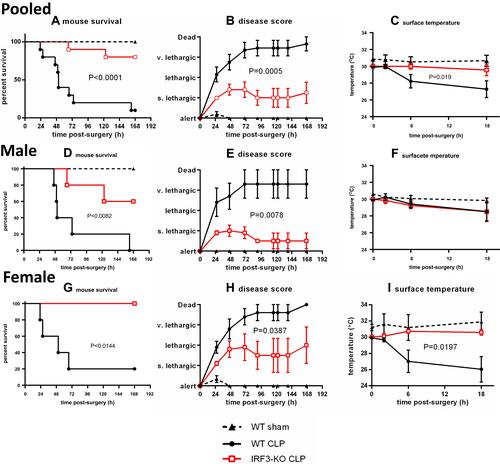
Figure 2 The cytokine response was attenuated in aged IRF3-KO septic mice. Aged WT and IRF3-KO mice were subject to CLP to induce sepsis, and a second group of aged WT mice were subject to sham surgery as a control. Graphs show pooled male and female data (n=10/group CLP, n=5/group sham) for (A) serum IL-6, (B) serum IL-12/23p40, (C) serum MCP-1. This cohort was split into male and female subgroups to show the impact of biological sex. Graphs show data for the male mice (n=5/group CLP, n=3/group sham), including: (D) serum IL-6, (E) serum IL-12/23p40, (F) serum MCP-1 and the female mice, (n=5/group CLP, n=2/group sham), including: (G) serum IL-6, (H) serum IL-12/23p40, and (I) serum MCP-1. P values show the results of Mann Whitney tests comparing the WT and IRF3-KO CLP groups at 6h and 18h.
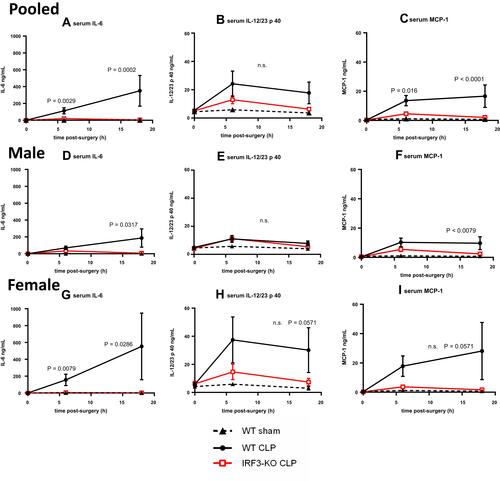
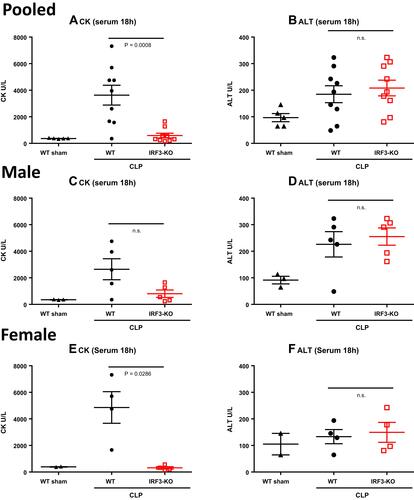
Figure 3 Serum CK and ALT levels in aged WT and IRF3-KO septic mice. Aged WT and IRF3-KO mice were subject to CLP to induce sepsis, and a second group of aged WT mice was subject to sham surgery as a control. At 18h post-surgery, serum CK levels were determined as a measure of heart/skeletal muscle damage, and serum ALT levels were determined as a measure of liver damage. Graphs show pooled male and female data (n=10/group CLP, n=5/group sham) for (A) serum CK and (B) serum ALT. This cohort was split into male and female subgroups to show the impact of biological sex. Graphs show data for the male mice (n=5/group CLP, n=3/group sham) including: (C) serum CK and (D) serum ALT; and the female mice (n=5/group CLP, n=2/group sham), including: (E) CK and (F) ALT. P values show the results of Mann Whitney tests comparing the WT and IRF3-KO CLP groups.