Figures & data
Table 1 Primers of Genes Used in PCR Analysis
Table 2 Distal Hemodynamics and Blood-Gas Analysis Before and After DAC
Figure 1 SCIRI caused acute paraplegia, spinal morphological changes and neuron loss following DAC. (A) SCIRI causes immediate acute paraplegia following DAC. Motor function is evaluated by BMS score. There was a significant difference between the two groups (P < 0.01). Detailly, the BMS score in the Sham group remained at the baseline of 9; While in the SCIRI group, the BMS score fell to 5 (4, 5) at P1, 5 (4, 5) at P3, 5 (4.5, 5) at P5, 5 (5, 5) at P7 and 6 (5, 6) at P14 (all P < 0.01), indicating that DAC caused an acute and moderate paraplegia in two weeks after SCIRI took place; Besides, BMS scores at P14 showed an elevation compared with P1 (P < 0.01), P3 (P < 0.01) and P5 (P = 0.036), indicating that DAC induced paraplegia gradually improved at the 2nd week. **P < 0.01, compared with the Sham group; #P < 0.05 and ##P < 0.01, compared with P14 in the SICRI group. N = 9 at each time point for both groups. (B) Cell Counting of motor neuron at the anterior horn showed a significant loss of motor neuron following DAC which lasted for the 2 weeks (P < 0.01); (C) morphological change and neuron loss in the spinal cord after SCIRI. HE staining results shown in the 1st line (scale bar = 100μm) and 2nd (scale bar = 25μm) indicated that DAC resulted in significant vacuolar necrosis and inflammatory cell infiltration into the grey matter of the spinal cord. Immunohistochemistry for NF-200 shown in the 3rd line (scale bar = 100μm) and 4th line (scale bar = 25μm) demonstrate that DAC caused progressive motor neuron loss in the anterior horn of the spinal cord (n = 3 for both groups at each time point).
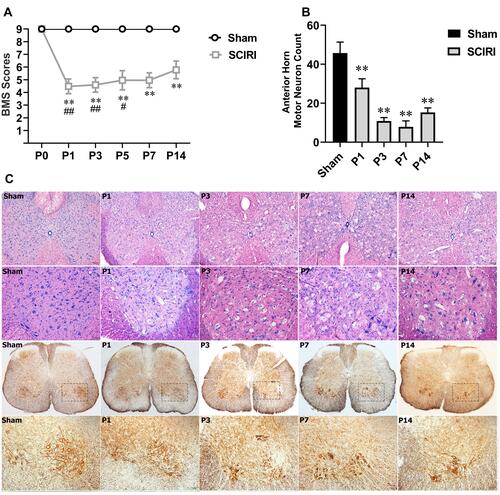
Figure 2 Time course of gene expression of M1 and M2 polarization markers following SCIRI. Quantitative PCR was used to assess the expression levels of M1- and M2-like microglial/macrophage activation genes in spinal cord of mice following SCIRI. n = 5 per group at each time point; *P < 0.05, **P < 0.01 compared with the Sham group.
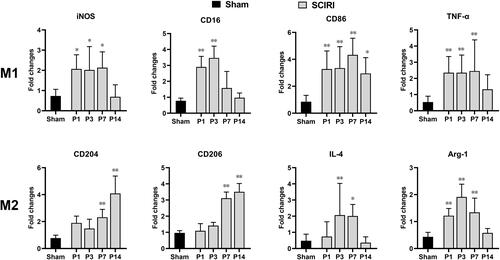
Figure 3 Dynamic changes in M1 and M2 phenotypes of macrophages following SCIRI. (A) The immuno-fluorescence staining of CD11b+ (green), CD86+ (red) and CD206+ (red) at P1, P3 and P7 after SCIRI. Scale bar = 100μm, n = 3 for each time point. (B) Quantification of CD11b+, CD86+ and CD206+ expressions at P1, P3 and P7 after SCIRI. *Represented P < 0.05 compared with the Sham group. **Represented P < 0.01 compared with the Sham group.
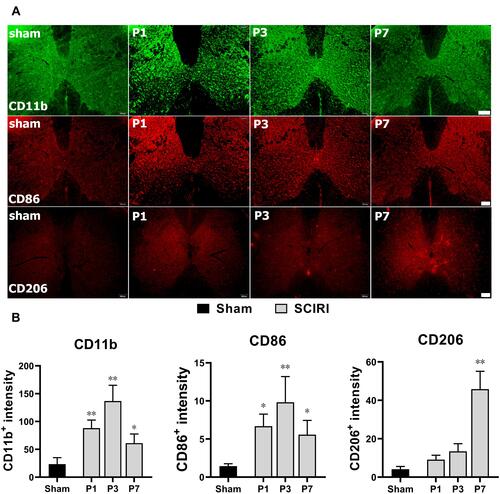
Figure 4 Colocalization of CD11b and CD86 (or CD206). Double immunofluorescence confirmed that both CD86 (red) and CD206 (red) were mainly accumulated in CD11b (green) positive cells. scale bar = 25μm.
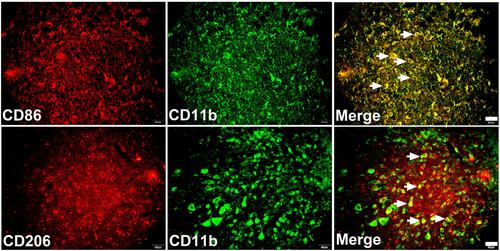
Figure 5 Microglia and invading MDMs display distinct patterns of polarization during SCIRI. (A) Examples of flow cytometry analysis of the spinal cord are shown, identifying monocyte-derived macrophages (MDMs) and microglia as CD45+CD11bhigh and CD45+CD11blow, respectively. (B) Spontaneous infiltration of circulating monocytes to the spinal cord increased after SCIRI. (C–F) Quantification of expression of CD86 (C and E), Dectin (D and F) in MDMs and microglia in spinal cord after SCIRI. Cells were pooled from 3 mice per group for a total of 3 separate experiments for each time point. *P < 0.05, **P < 0.01 compared with the Sham group.
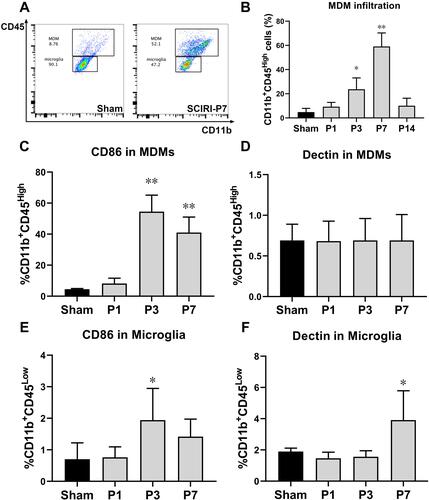
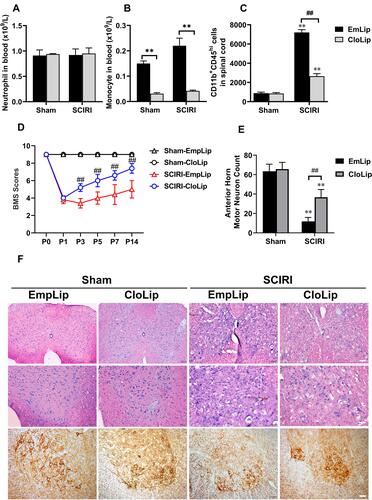
Figure 6 Depletion of MDMs improves long-term functional recovery and spinal cord damage after SCIRI. (A and B) Treatment with clodronate liposomes showed no effect on neutrophils but significantly reduced circulating monocytes in blood; (C) MDMs infiltration (recognized as CD11b+CD45hi cells) showed a marked elevation following SCIRI compared with the Sham group; While clodronate liposomes instead of empty liposomes application significantly alleviate MDMs infiltration at P3 following SCIRI; (D) Consecutive BMS scores showed a prominent elevation in SCIRI+CloLip group compared with the SCIRI+EmpLip group at P3, P5, P7 and P14 following SCIRI; (E) SCIRI induced a significant motor neuron loss at the anterior horn both in the CloLip and EmpLip groups; While a marked elevation of motor neuron counting could be detected at day 3 after clodronate liposomes treatment; (F) HE staining and Immunohistochemistry for NF-200 in the spinal cord in each group at day 3 following SCIRI. the 1st line scale bar = 100μm, line 2nd and 3rd scale bar = 25μm. n = 3 per group at each time point. **Represented P < 0.01, compared with the Sham group; ##Represented P < 0.01 compared with the SCIRI+CloLip group.