Figures & data
Table 1 Primer Sequences for RT-qPCR Analysis
Figure 1 HMGB1 was activated in the livers of ACLF rats.
Notes: (A–C) The expression levels of HMGB1 in the nucleus and cytoplasm were detected by Western blot. Histone H3 or GAPDH were used as the loading control. n=3 per group. (D) The expression and translocation of HMGB1 in the liver tissues of each group were determined by immunofluorescence (magnification, ×400; scale bar=100 µm). A region is boxed randomly in each group and the boxed regions are further enlarged below (magnification, ×1600; scale bar=25 µm). The arrows indicate cells that exhibited HMGB1 translocation from the nucleus to the cytoplasm. (E) Relative transcripts level of HMGB1 of rats in each group was detected by RT-qPCR. β-actin was used as internal reference. n=6 per group. (F–H) The levels of HMGB1, TLR4 and RAGE in serum were detected by ELISA. The normal group (n=9), the ACLF model group (n=8), the inhibitor groups (each n=7). (I–K) Western blot was used to detect the expressions of TLR4 and RAGE, and GAPDH was used as the loading control. n=3 per group. Asterisks indicate statistical significance: P*< 0.05, P**< 0.01, P***< 0.001, and P****< 0.0001.
Abbreviations: HMGB1, High mobility group box-1; ACLF, acute-on-chronic liver failure; RT-qPCR, quantitative real-time PCR; TLR4, Toll-like receptor 4; RAGE, receptor for advanced glycation end-products; ELISA, enzyme-linked immunosorbent assay.

Figure 2 The livers of ACLF rats showed severe hepatocyte pyroptosis.
Notes: (A–C) The expression levels of GSDMD and GSDMD-N were detected by Western blot, and GAPDH was used as the loading control. n=3 per group. (D and E) The percentage of GSDMD-positive cells in liver tissues of rats in each group was detected by immunofluorescence (magnification, ×400; scale bar=20 µm). A region is boxed randomly in each group and the boxed regions are further enlarged (magnification, ×1200; scale bar=20 µm). The arrows represent GSDMD-positive cells. n=3 per group. (F) The serum LDH levels of rats in each group. The normal group (n=9), the ACLF model group (n=8), the inhibitor groups (each n=7). (G and H) ELISA was used to determine the levels of IL-1β and IL-18 in liver tissues. The normal group (n=9), the ACLF model group (n=8), the inhibitor groups (each n=7). (I–L) The expressions of pro-IL-1β, IL-1β and IL-18 were detected by Western blot, and GAPDH was used as the loading control. n=3 per group. (M and N) Relative transcript levels of IL-1β and IL-18 in the different groups were detected by RT-qPCR. β-actin was used as internal reference. n=6 per group. (O and P) Immunofluorescence triple staining of TUNEL, active Caspase-1 and ALB was used to further investigate hepatocyte pyroptosis in ACLF rats (magnification, ×400; scale bar=20 µm). A region is boxed randomly in each group and the boxed regions are further enlarged below (magnification, ×1200; scale bar=20 µm). The arrows represent active Caspase-1+/TUNEL+/ALB+ triple-positive cells. n=3 per group. Asterisks indicate statistical significance: P*< 0.05, P**< 0.01, P***< 0.001, and P****< 0.0001.
Abbreviations: ACLF, acute-on-chronic liver failure; GSDMD, Gasdermin D; LDH, lactate dehydrogenase; ELISA, enzyme-linked immunosorbent assay; IL-1β, interleukin-1 β; IL-18, interleukin-18; RT-qPCR, quantitative real-time PCR; TUNEL, terminal deoxynucleotidyl transferase dUTP nick end labeling.
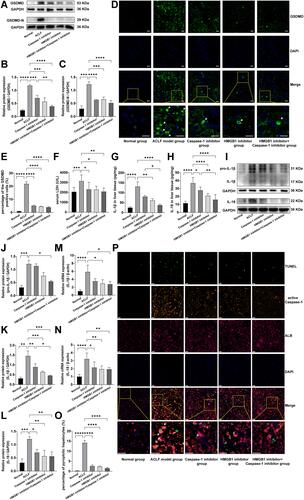
Figure 3 HMGB1 induced hepatocyte pyroptosis in ACLF rats by activating the Caspase-1-dependent pyroptosis pathways.
Notes: (A–E) The expression levels of NF-κB, NLRP3, ASC, Caspase-1 and cleaved Caspase-1 were detected by Western blot, and GAPDH was used as the loading control. n=3 per group. (F and G) Relative transcript levels of NLRP3 and Caspase-1 in the different groups were detected by RT-qPCR. β-actin was used as internal reference. n=6 per group. (H and I) ELISA was used to determine the levels of IL-6 and TNF-α in liver tissues. The normal group (n=9), the ACLF model group (n=8), the inhibitor groups (each n=7). Asterisks indicate statistical significance: P*< 0.05, P**< 0.01, P***< 0.001, and P****< 0.0001.
Abbreviations: HMGB1, High mobility group box-1; ACLF, acute-on-chronic liver failure; ASC, the adaptor protein apoptosis-associated speck-like protein containing a caspase recruitment domain; RT-qPCR, quantitative real-time PCR; ELISA, enzyme-linked immunosorbent assay; IL-6, interleukin-6; TNF-α, tumor necrosis factor-α.
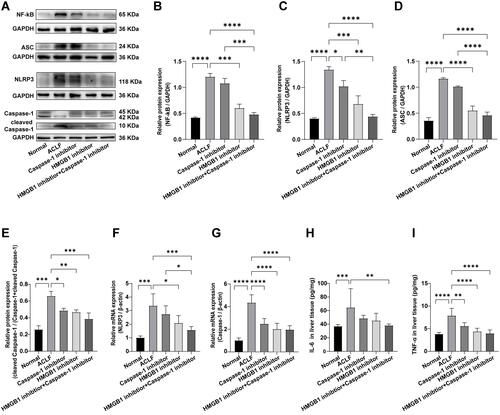
Figure 4 Pathological damage of liver tissue in each group.
Notes: (A) HE staining of hepatic tissues from the different groups (magnification, ×100, ×200, and ×400; scale bar=100, 50, and 20 µm); (B) MT staining of hepatic tissues from the different groups (magnification, ×50 and ×100; scale bar=200 and 100 µm); (C) TEM was used to examine the ultrastructural changes of hepatocytes, including the hepatocyte nucleus, cytoplasm, mitochondria, lysosome, and ER (magnification, ×3000, ×3000, ×12,000, ×25,000, and ×25,000; scale bar=2 µm, 2 µm, 500 nm, 200 nm, and 200 nm).
Abbreviations: HE staining, hematoxylin and eosin staining; MT staining, masson’s trichrome staining; TEM, transmission electron microscopy; ER, endoplasmic reticulum.
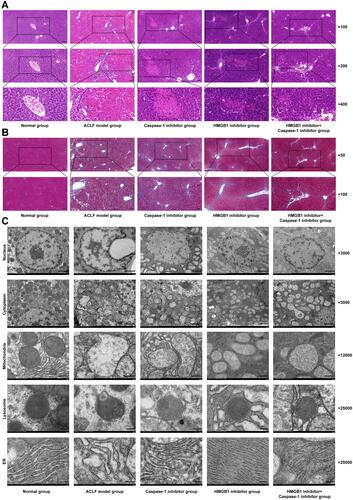
Figure 5 Liver function and coagulation function of rats in each group.
Notes: (A) Serum ALT level; (B) Serum AST level; (C) Serum TBIL level; (D) Serum ALB level; (E) PT in each group; (F) INR in each group. The normal group (n=9), the ACLF model group (n=8), the inhibitor groups (each n=7). Asterisks indicate statistical significance: P*< 0.05, P**< 0.01, P***< 0.001, and P****< 0.0001.
Abbreviations: ALT, alanine aminotransferase; AST, aspartate aminotransferase; TBIL, total bilirubin; ALB, albumin; PT, prothrombin time; INR, international normalized ratio.
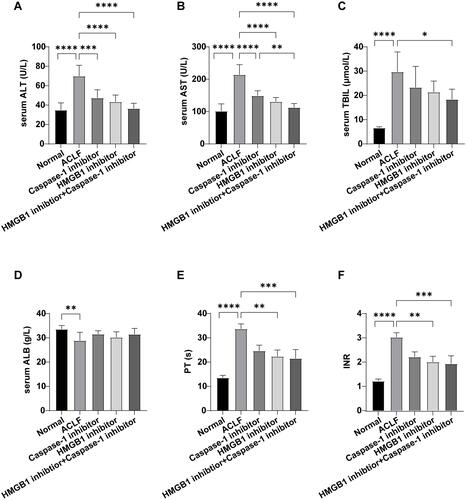
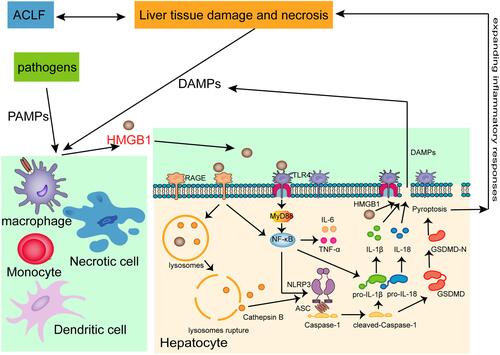
Figure 6 Schematic diagram of HMGB1-induced hepatocyte pyroptosis pathways and their relationship with ACLF.
Abbreviations: ACLF, acute-on-chronic liver failure; PAMPs, Pathogen-associated molecular patterns; DAMPs, Damage-associated molecular patterns; HMGB1, High mobility group box-1; RAGE, receptor for advanced glycation end-products; TLR4, Toll-like receptor 4; MyD88, myeloid differentiation factor 88; IL-6, interleukin-6; TNF-α, tumor necrosis factor-α; ASC, the adaptor protein apoptosis-associated speck-like protein containing a caspase recruitment domain; IL-1β, interleukin-1 β; IL-18, interleukin-18; GSDMD, Gasdermin D.