Figures & data
Figure 1 Activation of the NLRP3 pathway was associated with RVF in PAH rats. (A) PET-CT image of PAH rat hearts showing a thickened wall and dilated chamber of the right ventricle in a rat with pulmonary hypertension. (B) The RVSP of the PAH rats before and after LPS injection is shown. The significance of differences was determined with unpaired Welch’s t-test (n = 6). (C) The FAC [FAC = (end-diastolic area - end-systolic area)/end-diastolic area×100%] in the PAH rats before and after LPS injection is shown. The significance of differences was analysed with unpaired Welch’s t-test (n=6). (D) The IL-1β mRNA level in normal rats (SD rats were fed for 28 days after intraperitoneal injection of saline, and the samples were collected 6 hours after another intraperitoneal injection of saline), normal+LPS rats (SD rats were fed for 28 days after intraperitoneal injection of saline, and the samples were collected 6 hours after intraperitoneal injection of LPS), PAH rats (SD rats were fed for 28 days after intraperitoneal injection of MCT, and the samples were collected 6 hours after intraperitoneal injection of saline), and PAH+LPS rats (SD rats were fed for 28 days after intraperitoneal injection of MCT, and the samples were collected 6 hours after intraperitoneal injection of LPS). The significance of differences among groups was determined by one-way ANOVA (n = 5). (E) The TNF-α mRNA level in the right ventricles of rats in the abovementioned four groups is shown. The significance of differences among groups was determined by one-way ANOVA (n = 5). (F) The IL-6 mRNA level in the right ventricles of rats in the four abovementioned groups is shown. The significance of differences among the groups was determined by one-way ANOVA (n = 5). (G) IL-1β immunofluorescence in the right ventricle of PAH rats and PAH+LPS rats 6 h after LPS injection. (H) LPS significantly increased IL-1β expression in the right ventricle compared with the left ventricle in rats with pulmonary hypertension. The ratio of the IL-1β area% in the right ventricle to that in the left ventricle is shown. The significance of differences was determined with an unpaired Welch’s t-test (n = 3). (I) NLRP3, cleaved-casp1, GSDMD, GSDMD-N and GAPDH protein expression in the right ventricles of rats in the abovementioned four groups. (J) NLRP3 is an important upstream molecule of the pyroptosis pathway, which is involved in the formation of inflammasomes and cleavage of pro-casp1. The NLRP3 protein level in the right ventricle of rats in the abovementioned four groups is shown. The significance of the difference was analysed by one -way ANOVA (n = 3). (K) Cleaved casp1 cleaved the IL-1B precursor to generate mature IL-1B and cleaved GSDMD to expose GSMDM-N, thereby promoting cell lysis and pyroptosis. The cleaved casp1 protein level in the right ventricles of rats in the abovementioned four groups is shown. The significance of the difference was analysed by one -way ANOVA (n = 3). (L) GSDMD is an executor of pyroptosis, and the GSDMD N-terminal domain can assemble membrane pores to induce pyroptosis. The GSDMD-N protein level in the right ventricle of rats in the abovementioned four groups is shown. The significance of the difference was analysed by one -way ANOVA (n = 3). *p < 0.05, **p < 0.01, ***p < 0.001, ****p < 0.0001.
![Figure 1 Activation of the NLRP3 pathway was associated with RVF in PAH rats. (A) PET-CT image of PAH rat hearts showing a thickened wall and dilated chamber of the right ventricle in a rat with pulmonary hypertension. (B) The RVSP of the PAH rats before and after LPS injection is shown. The significance of differences was determined with unpaired Welch’s t-test (n = 6). (C) The FAC [FAC = (end-diastolic area - end-systolic area)/end-diastolic area×100%] in the PAH rats before and after LPS injection is shown. The significance of differences was analysed with unpaired Welch’s t-test (n=6). (D) The IL-1β mRNA level in normal rats (SD rats were fed for 28 days after intraperitoneal injection of saline, and the samples were collected 6 hours after another intraperitoneal injection of saline), normal+LPS rats (SD rats were fed for 28 days after intraperitoneal injection of saline, and the samples were collected 6 hours after intraperitoneal injection of LPS), PAH rats (SD rats were fed for 28 days after intraperitoneal injection of MCT, and the samples were collected 6 hours after intraperitoneal injection of saline), and PAH+LPS rats (SD rats were fed for 28 days after intraperitoneal injection of MCT, and the samples were collected 6 hours after intraperitoneal injection of LPS). The significance of differences among groups was determined by one-way ANOVA (n = 5). (E) The TNF-α mRNA level in the right ventricles of rats in the abovementioned four groups is shown. The significance of differences among groups was determined by one-way ANOVA (n = 5). (F) The IL-6 mRNA level in the right ventricles of rats in the four abovementioned groups is shown. The significance of differences among the groups was determined by one-way ANOVA (n = 5). (G) IL-1β immunofluorescence in the right ventricle of PAH rats and PAH+LPS rats 6 h after LPS injection. (H) LPS significantly increased IL-1β expression in the right ventricle compared with the left ventricle in rats with pulmonary hypertension. The ratio of the IL-1β area% in the right ventricle to that in the left ventricle is shown. The significance of differences was determined with an unpaired Welch’s t-test (n = 3). (I) NLRP3, cleaved-casp1, GSDMD, GSDMD-N and GAPDH protein expression in the right ventricles of rats in the abovementioned four groups. (J) NLRP3 is an important upstream molecule of the pyroptosis pathway, which is involved in the formation of inflammasomes and cleavage of pro-casp1. The NLRP3 protein level in the right ventricle of rats in the abovementioned four groups is shown. The significance of the difference was analysed by one -way ANOVA (n = 3). (K) Cleaved casp1 cleaved the IL-1B precursor to generate mature IL-1B and cleaved GSDMD to expose GSMDM-N, thereby promoting cell lysis and pyroptosis. The cleaved casp1 protein level in the right ventricles of rats in the abovementioned four groups is shown. The significance of the difference was analysed by one -way ANOVA (n = 3). (L) GSDMD is an executor of pyroptosis, and the GSDMD N-terminal domain can assemble membrane pores to induce pyroptosis. The GSDMD-N protein level in the right ventricle of rats in the abovementioned four groups is shown. The significance of the difference was analysed by one -way ANOVA (n = 3). *p < 0.05, **p < 0.01, ***p < 0.001, ****p < 0.0001.](/cms/asset/457ce0f9-7956-494f-b580-353e91808f88/djir_a_12190527_f0001_c.jpg)
Table 1 Sequences of Primers Used for Real-Time qPCR Experiments
Table 2 Flow Cytometry Antibody
Figure 2 NLRP3 inhibition effectively protected right ventricular function, relieved the asymmetrical IL-1β elevation and erased the change in inflammation in the right ventricle. (A) The FAC in PAH+LPS rats (SD rats were fed for 28 days after intraperitoneal injection of MCT; intravenous injection of saline was performed 1 hour before LPS injection, and the samples were collected 6 hours after intraperitoneal injection of LPS) and PAH+MCC950+LPS rats (SD rats were fed for 28 days after intraperitoneal injection of MCT; intravenous injection of MCC950 was performed 1 hour before LPS injection, and the samples were collected 6 hours after intraperitoneal injection of LPS) before and after LPS injection is shown. The significance of differences was determined with two-way ANOVA (n = 6). (B) IL-1β immunofluorescence in the right ventricle of PAH+LPS rats and PAH+MCC950+LPS rats 6 h after LPS injection. (C) Pretreatment with MCC950 significantly alleviated the asymmetrically increased IL-1β expression in myocardial tissue of the right ventricle. The ratio of the IL-1β area% in the right ventricle to that in the left ventricle is shown. The significance of differences was determined with unpaired Welch’s t-test (n = 3). (D) The IL-1β mRNA level in the right ventricles of rats in the two abovementioned groups. The significance of differences was determined with unpaired Welch’s t-test (n = 6). (E) The TNF-α mRNA level in the right ventricles of rats in the two abovementioned groups. The significance of differences was determined with unpaired Welch’s t-test (n = 6). (F) The IL-6 mRNA level in the right ventricle of rats in the two abovementioned groups. The significance of differences was determined with unpaired Welch’s t-test (n = 6). (G) A total of 67 cytokines and chemokines in right ventricular tissue were tested with a cytokine array. The heat map shows that the expression of 6 factors (MCP-1, b-NGF, CINC-1, CINC-2, CINC3, and fractalkine) was increased in the right ventricular myocardium of PAH rats after LPS injection. (H) Heat map showing that 13 factors (MCP-1, b-NGF, CINC-1, CINC-2, CINC3, ICAM-1, TIMP-1, LIX, IL-1β, IL-1α, L-selectin, TWEAK R, and P-cadherin) remained at low levels in the right ventricular myocardium of PAH+MCC950+LPS rats after LPS injection. The significance of differences between two groups was determined with an unpaired Student’s t-test (n = 3–4). *p < 0.05, ***p < 0.001, ****p < 0.0001.
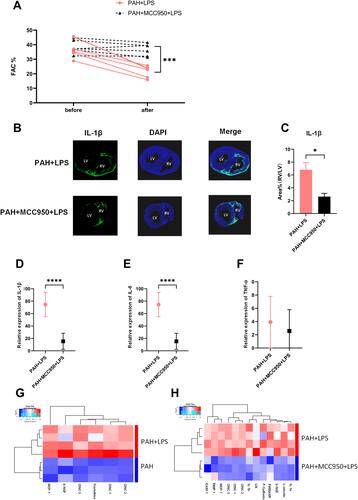
Figure 3 Changes in the proportion of immune cells in myocardial tissue were analysed via flow cytometry. (A) The proportion of CD45+ cells in each group was detected by flow cytometry. (B) The proportion of CD45+CD11b+ cells in each group was detected by flow cytometry. (C) The proportion of CD68+CD86+ cells in each group was detected by flow cytometry. (D) Pulmonary hypertension and LPS caused a significant increase in the proportion of CD45-positive inflammatory cells in right ventricular tissue (normal vs PAH, normal vs normal + LPS, n = 3). (E) CD45-positive/CD11b-positive mononuclear macrophage infiltration was significantly elevated in right ventricular tissues from rats subjected to PAH or LPS (normal vs PAH, normal vs normal + LPS, normal + LPS vs PAH + LPS, n = 3). (F) The proportion of CD68-positive/CD86-positive M1 macrophages was decreased in the hearts of PAH rats and significantly increased in the right ventricular tissues of PAH rats stimulated with LPS, but MCC950 application significantly inhibited the change in the proportion of CD68-positive/CD86-positive M1 macrophages (n = 3). The significance of the difference was analysed by one-way ANOVA, **p < 0.01, ***p < 0.001, ****p < 0.0001.
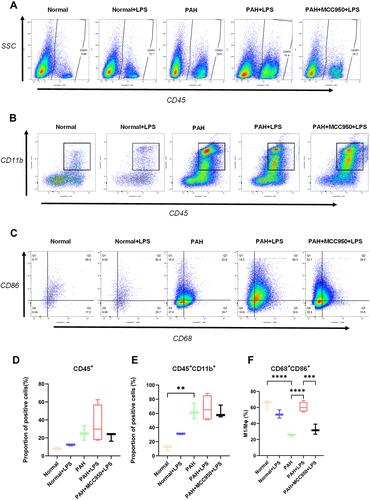
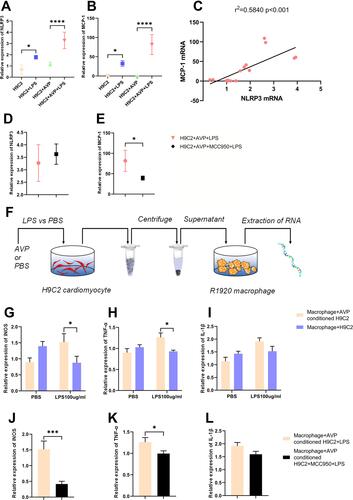
Figure 4 Through the NLRP3 pathway, cardiomyocytes participate in the macrophage polarization process through increased MCP-1 expression and cell pyroptosis under LPS stimulation. (A) We exposed H9C2 cells to AVP (1 µmol/mL) for 72 h to simulate hypertrophy of the right ventricular myocardium in rats with pulmonary hypertension, to MCC950 (100 mM) for 1 h to inhibit the NLRP3 pathway, and to LPS (100 µg/mL) for 6 h to mimic the in vivo inflammation state in the RVF model. The NLRP3 mRNA level in the H9C2, H9C2+LPS, H9C2+AVP, H9C2+AVP+LPS, and H9C2+AVP+MCC950+LPS cell groups is shown. The significance of the difference was analysed by one-way ANOVA (n = 3). (B) The MCP-1 mRNA level in the five abovementioned groups of cells is shown. The significance of the difference was analysed by one-way ANOVA (n = 3). (C) We analysed the correlation between NLRP3 and MCP-1 mRNA expression in H9C2 cell samples from different treatment groups. MCP-1 expression was highly correlated with NLRP3 expression (n = 14, r2 = 0.5840, p < 0.001). (D) The NLRP3 mRNA level in the H9C2+AVP+LPS and H9C2+AVP+MCC950+LPS cell groups is shown. The significance of differences was determined with an unpaired Welch’s t-test (n = 6). (E) NLRP3 inhibition decreased MCP-1 transcription, and the MCP-1 mRNA level in the H9C2+AVP+LPS and H9C2+AVP+MCC950+LPS cell groups. The significance of differences between two groups was determined with an unpaired Welch’s t-test (n = 6). (F) We exposed macrophages to supernatant collected from H9C2 cells in different groups and extracted RNA for subsequent analysis. (G) The supernatant collected from AVP+LPS-conditioned H9C2 cells enhanced iNOS transcription in macrophages. The iNOS mRNA level in the macrophage+H9C2+PBS, macrophage+H9C2+LPS, macrophage+AVP-conditioned H9C2+PBS and macrophage+AVP-conditioned H9C2+LPS cell groups is shown. The significance of differences between two groups was determined with unpaired Welch’s t-test (n = 3). (H) The supernatant collected from AVP+LPS-conditioned H9C2 cells enhanced TNF-α transcription in macrophages. The TNF-α mRNA level in the macrophage+H9C2+PBS, macrophage+H9C2+LPS, macrophage+AVP-conditioned H9C2+PBS and macrophage+AVP-conditioned H9C2+LPS cell groups is shown. The significance of differences between two groups was determined with an unpaired Welch’s t-test (n = 3). (I) The IL-1β mRNA level in the macrophage+H9C2+PBS, macrophage+ H9C2+LPS, macrophage+AVP-conditioned H9C2+PBS and macrophage+AVP-conditioned H9C2+LPS cell groups is shown. The significance of differences between two groups was determined with an unpaired Welch’s t-test (n = 3). (J) MCC950 administration cancelled the enhanced effect of AVP+LPS-conditioned H9C2 cell supernatant on iNOS transcription in macrophages. The iNOS mRNA level in the macrophage+AVP-conditioned H9C2+LPS and macrophage+AVP-conditioned H9C2+MCC950+LPS cell groups is shown. The significance of differences was determined with unpaired Welch’s t-test (n = 3). (K) MCC950 administration cancelled the enhanced effect of AVP+LPS-conditioned H9C2 cell supernatant on TNF-α transcription in macrophages. The TNF-α mRNA level in the macrophage+AVP-conditioned H9C2+LPS and macrophage+AVP-conditioned H9C2+MCC950+LPS cell groups is shown. The significance of differences was determined with unpaired Welch’s t-test (n = 3). (L) The IL-1β mRNA level in macrophage+AVP-conditioned H9C2+LPS and macrophage+AVP-conditioned H9C2+MCC950+LPS cell groups is shown. The significance of differences was analysed with unpaired Welch’s t-test (n = 3). *p < 0.05, ***p < 0.001, ****p < 0.0001.