Figures & data
Figure 1 Dysbiosis patterns of gut microbiota in psoriasis patients. (A) Comparison of alpha-diversity indices (Shannon Index, ACE, Chao1 Index and observed species) between healthy donor and psoriasis patient groups. Data are presented as the mean ± SD by Wilcoxon rank-sum test: ** p < 0.01, *** p < 0.001 (B) Principal coordinate analysis based on unweighted UniFrac distances. (C) Community composition at the phylum level of each sample. (D) Heatmap cluster of the community composition at the family level of each sample of healthy donor and psoriasis patient. (E) Community composition at the family level was assessed. Anova & Student t-test statistical analyses of means ± SD: * p < 0.05, ** p < 0.01.
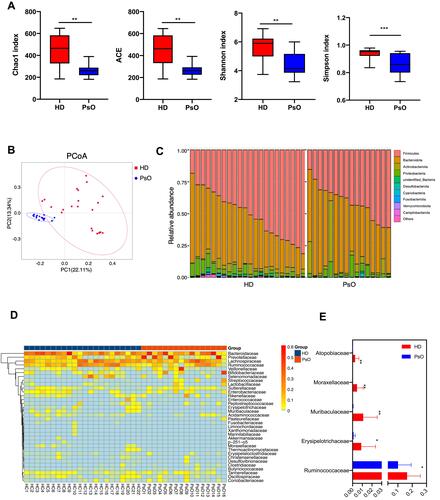
Figure 2 Transfer of healthy but not psoriasis donor’s microbiota protects against psoriasis-like skin inflammation. (A) Experimental setting of the in vivo model of imiquimod induced psoriasis-like skin inflammation model. (B) Changes of body weight following imiquimod treatment of mice receiving feces from 5 healthy (HD) or 5 psoriasis patient donors (PSD). Pooled data from all humans (left) or individuals (right), each feces being transferred into 8–10 mice/group. (C) PASI score of HD and PSD measured at day 7. (D) Representative photographs of left ear and back skin of HD and PSD. Photos were taken at day 7. (E and F) Thickness of ear and skin measured by Digimatic Caliper at day 7. (G) H&E stained ear and skin sections of HD and PSD mice after imiquimod treatment. (H and I) Quantification of histopathological score (0–2) after H&E staining of the ear and skin. All experiments included eight to ten mice per human donor. Scale bar, 100μm. Anova & Student t-test statistical analyses of means ± SD: *p < 0.05, **p < 0.01, ***p < 0.001, ****p < 0.0001.
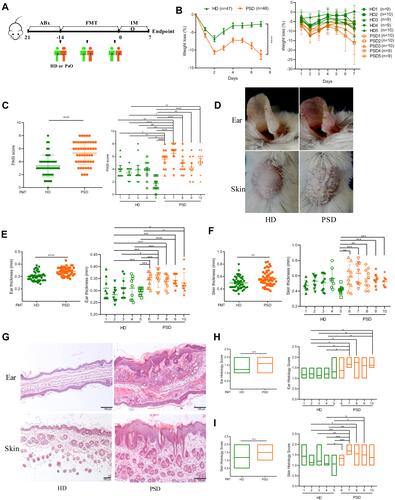
Figure 3 FMT of feces from healthy donors protects against imiquimod induced Treg/Th17 imbalance. Cells from spleen of HD (donor 2 and 5) and PSD (donor 2, 3 and 5) were isolated and analyzed for Th17. (A) and Treg cells (C) counts. Statistical analysis data (B and D) are shown in the right panel. Each point represents one mouse. Anova & Student t-test statistical analyses of means ± SD: *p < 0.05, **p < 0.01. (E) The Treg /Th17 cells ratio. Anova & Student t-test statistical analyses of means ± SD: ** p < 0.01 (F and G) The mRNA expression levels of cytokines (F) and chemokines (G), including IL17A, IL1b, IL23, IL6, CXCL1, CXCL2, S100A8, S100A9, CCL2 and CCL20 in the skin lesion of the HD and PSD mice after imiquimod treatment (n=6 per group). Anova & Student t-test statistical analyses of means ± SD: *p < 0.05, **p < 0.01, ***p < 0.001. (H) The mRNA level of IL10 in the skin lesion (n=6 per group). Anova & Student t-test statistical analyses of means ± SD: *p < 0.05.
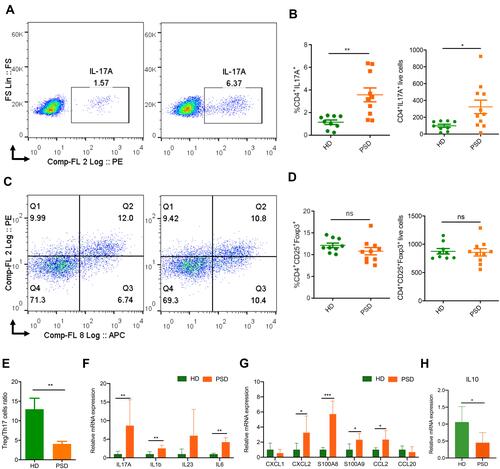
Figure 4 Characterization of the gut microbiota profile in mice after FMT. (A) Taxonomic classification of bacterial 16S sequence detected in human donor stools and FMT recipient mice stools by origin. (B) Comparison of alpha-diversity indices (Shannon Index and observed species) between HD (n=11) and PSD groups (n=12). Anova & Student t-test statistical analyses of means ± SD: *p < 0.05, **p < 0.01. (C) Principal coordinate analysis based on Bray–Curtis distances of fecal gut microbiome derived from HD (green dots) and PSD (Orange dots) treatment mice. (D) Heatmap cluster of the community composition at the genus level of each mice of HD and PSD. (E) Statistical analysis (unpaired t-test) of the community composition at the genus level between HD and PSD mice. Anova & Student t-test statistical analyses of means ± SD: *p < 0.05. (F) Relative abundance of the gut microbiota taxa identified at genus level. (G) The Bacteroides/Lactobacillus ratio between HD and PSD. Anova & Student t-test statistical analyses of means ± SD: *p < 0.05.
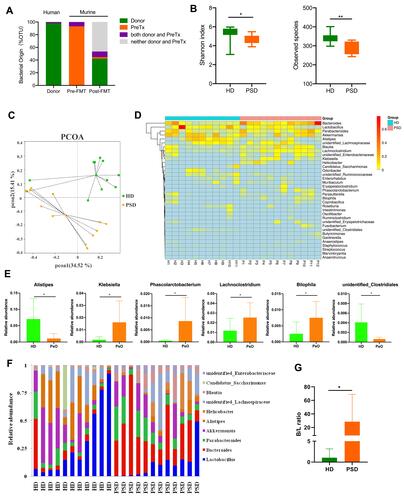
Figure 5 FMT of feces from healthy donors rapidly create a Lactobacillus-predominated gut microbial community in mice. (A) Correlation network of microbiota resident in the HD group. (B) Heat map showing Spearman’s rank correlation coefficient between relative abundance of genera level and clinical index. *p < 0.05, **p < 0.01. (C) Association of specific microbiota taxa with the group of HD and PSD by linear discriminant analysis (LDA) effect size (LEfSe). Green indicates taxa enriched in PSD group and red indicates taxa enriched in the HD group. (D) Variable importance for the best set of discriminatory taxa identified by RandomForest analysis. (E) Contribution for the best set of discriminatory taxa identified by Simper analysis.
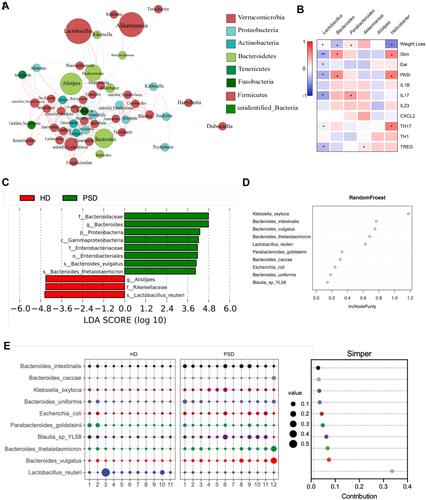
Figure 6 Community differentiation of the cutaneous microbiota in HD and PSD mice. (A) The venn plot between cutaneous microbiota in HD and PSD mice. (B) Principal component analysis (PCA) analysis based on unweighted UniFrac distances. (C) Relative abundance of the skin microbiota taxa identified at phylum level. (D) Community composition at the phylum level was assessed. Anova & Student t-test statistical analyses of means ± SD: *p < 0.05. (E) Heatmap cluster of the community composition at the genus level. (F) Variable importance for the best set of discriminatory taxa identified by RandomForest analysis. (G) Heat map showing Spearman’s rank correlation coefficient between relative abundance of species level and clinical index.
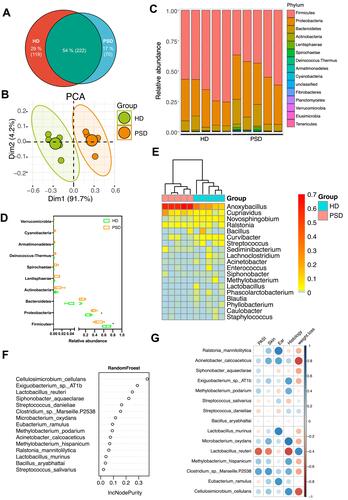
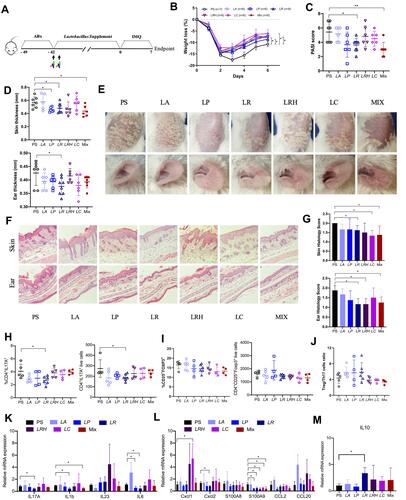
Figure 7 Supplement of Lactobacillus reuteri reduced Th17 cells count and contributed to alleviation of psoriasis like symptoms. (A) Graphical representation of the experimental design. (B) Changes in animal’s weight of imiquimod treated mice colonized with saline (PS, n=7) or colonized with five different Lactobacillus species (n=6–8). (C) PASI score of PS, LA, LP, LR, LRH, LC and MIX measured at day 7. (D) Thickness of skin and ear measured by Digimatic Caliper at day 7. (E) Representative photographs of back skin and ear in PS (n=7), LA (n=6), LP (n=6), LR (n=8), LRH (n=6), LC (n=6) and MIX (n=6). Photos were taken at day 7. (F) H&E stained skin sections of PS, LA, LP, LR, LRH, LC and MIX mice after imiquimod treatment, with 3–5 mice for each group. (G) Quantification of histopathological score (0–2) after H&E staining of the ear and skin. (H and I) Treg and Th17 cells were analysed by flow cytometry for the expression of CD4+ CD25+ Foxp3+ and CD4+ IL-17A+, respectively. Percentages and counts of Th17 cells (H) and Treg cells (I) in the spleen were determined. (J) The ratio of Treg/Th17 cells. (K and L) Messenger RNA levels of key cytokines (K) and chemokines (L) in the skin, with 3–4 mice per each group. (M) The mRNA level of IL10 in the skin (n=3–4 per group). Data are presented as the mean ± SD: *p < 0.05, **p < 0.01.