Figures & data
Table 1 Primer Sequences Used for Real-Time PCR Amplifications
Figure 1 Methylglyoxal (MGO) increases the number of total cells and neutrophils in bronchoalveolar lavage fluid (BAL) of mice intranasally instilled with lipopolysaccharide (LPS). Mice were treated or not with 0.5% MGO in the drinking water for 12 weeks, and then intranasally instilled with LPS (30 µg). (A–C) show total cells, neutrophils, and mononuclear cells in BAL fluid at 6 h following LPS exposure (or instillation with saline). Data are expressed as mean ± SEM. *P < 0.05 compared with respective saline group; #P < 0.05 compared with LPS in control mice.
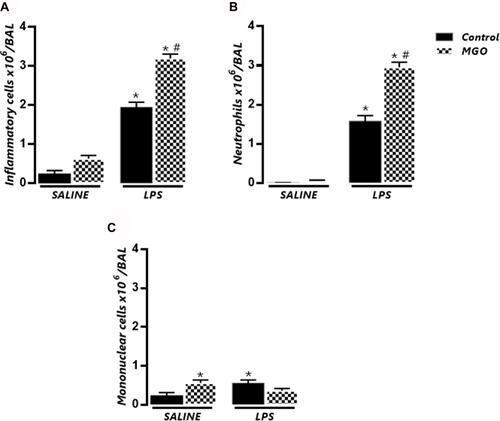
Figure 2 Methylglyoxal (MGO) increases the neutrophil infiltration in lung connective tissue surrounding the bronchial and bronchiolar segments in lipopolysaccharide (LPS)-exposed mice. (A) shows representative photomicrographs of bronchiolar segments at 6 h following LPS exposure (or instillation with saline) for each experimental group. (B) and (C) show the number of total inflammatory cells and neutrophils, respectively. Each column represents mean ± SEM of the number of cells mm2 for each group. Haematoxylin–eosin, high magnification (bar represents 200 μm). *P < 0.05 compared with the respective control group; #P < 0.05 compared with LPS in control group.
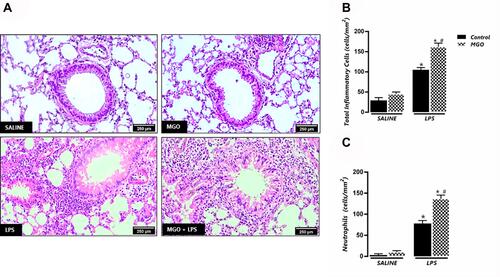
Figure 3 Methylglyoxal (MGO) increases the levels of pro-inflammatory cytokines in bronchoalveolar lavage (BAL) fluid of lipopolysaccharide (LPS)-exposed mice. (A–E) show IFN-γ, TNF-α, IL-1β, IL-17 and IL-10, respectively, in BAL fluid at 6 h following LPS exposure (or instillation with saline). Each column represents the mean ± SEM. Data are expressed as mean ± SEM. *P < 0.05 compared with respective saline group; #P < 0.05 compared with LPS in control group.
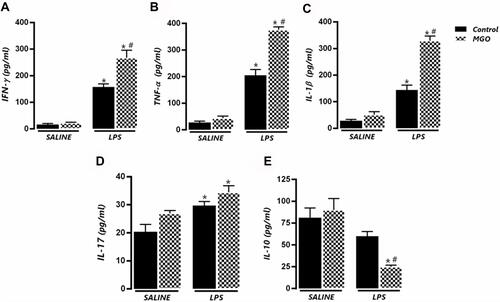
Figure 4 Effects of methylglyoxal (MGO) on the mRNA expressions of TNF-α (A), IL-1β (B) and cyclooxygenase-2 (COX-2; C) in lung tissues of lipopolysaccharide (LPS)-exposed mice. The mRNA expression levels of TNF-α, IL-1β and COX-2 were evaluated at 6 h following LPS exposure (or instillation with saline). Each gene was normalized to 18 S rRNA expression levels, and the values are expressed in arbitrary units (a.u). Data are means ± SEM. *P < 0.05 compared with control group; #P < 0.05 compared with LPS in control group.
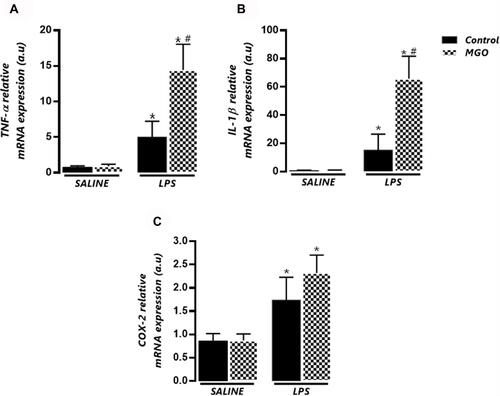
Figure 5 Methylglyoxal (MGO) increases immunostaining and mRNA expression of RAGE in airways of lipopolysaccharide (LPS)-exposed mice. (A) shows representative photomicrographs of immunohistochemistry of bronchiolar segments at 6 h following LPS exposure (or instillation with saline), as evidenced by the brown color in the bronchial epithelium. (B) shows the RAGE immunostaining. (C) shows the RAGE mRNA expression (gene normalized to 18 SrRNA) and data expressed in arbitrary units (a.u). Micrographs recorded at 150× magnification. Data are means ± SEM. *P < 0.05 compared with control group; #P < 0.05 compared with LPS in control group.
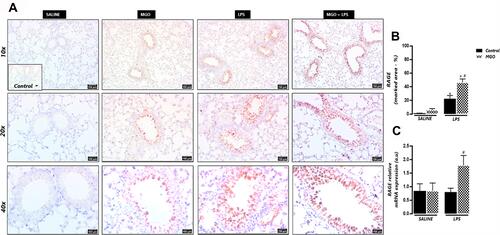
Figure 6 Serum levels of methylglyoxal (MGO) in control (CT) and MGO-treated mice in association or not with metformin (MET). Mice were treated or not with 0.5% MGO in the drinking water for 12 weeks, and metformin was given (300 mg/kg) in the last two weeks of MGO treatment. *P < 0.05 compared with MGO+MET group.
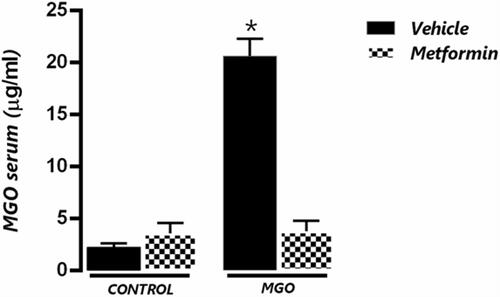
Figure 7 Metformin suppresses the potentiation by methylglyoxal (MGO) of LPS-induced lung inflammation. Mice were intranasally instilled saline or LPS (30 µg). Panels show respectively number of total inflammatory cells (A) neutrophil number (B) TNF-α levels in BALF (C) TNF-α mRNA expression in lung tissue (D) IL-1β levels in BALF (E) IL-1β mRNA expression in lung tissue (F) IFN-γ levels in BALF (G) and RAGE mRNA expression (H). Data are expressed as mean ± SEM. *P < 0.05 compared with the LPS + metformin group.
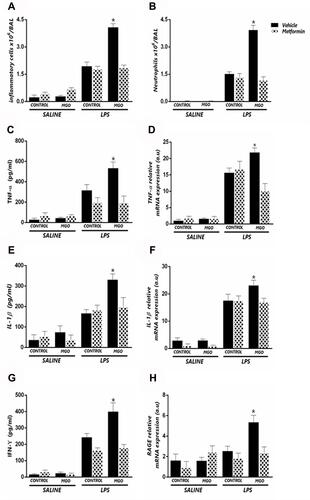
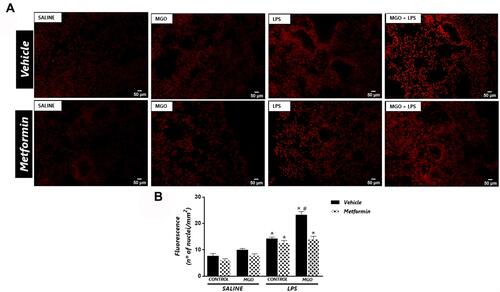
Figure 8 Metformin reduces the increased the reactive-oxygen species (ROS) levels in lungs of lipopolysaccharide (LPS)-exposed mice treated with methylglyoxal (MGO). (A) shows representative photomicrographs of the lung sections, and (B) shows quantitative ROS levels through dihydroethidium (DHE)-induced fluorescence in all groups. Data are means ± SEM. *P < 0.05 compared with respective saline groups; #P < 0.05 compared with LPS-MGO group.