Figures & data
Table 1 Information per Study Subject on Treatment, Fecal and Blood Shedding, Colitis Score, Clinical and Pathological Remarks.
Table 2 Primary Antibodies Used for immunohistochemistry and Immunofluorescence
Table 3 Cecum Typhlitis Score per Study Subject
Figure 1 Representative HE-stained proximal colon sections images of cynomolgus macaques of no-colitis control (A, B); MO3) and moderate colitis (C, D; LM9) after oral LM inoculation. (A, C) at 4× magnification. (B, D) at 40× magnification. Note increased lymphoplasmacytic and eosinophilic inflammation in the lamina propria with glandular displacement in the colitis subject. Black arrow, plasma cell; circle, eosinophil; square, lymphocyte. Scale bar = 100µm for all panels.
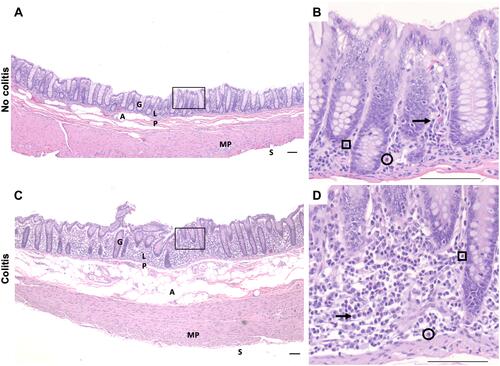
Figure 2 Images of proximal colon of cynomolgus macaques treated with mock (MO1) or LM (LM7) inoculations immunostained against markers of inflammation (A-C; HLA-DR, CD3, CD20) and oxidative stress (D; 8-OHdG) and their %AAT expression and OD expression (mean ± SEM). Scale bar = 25µm for all panels.
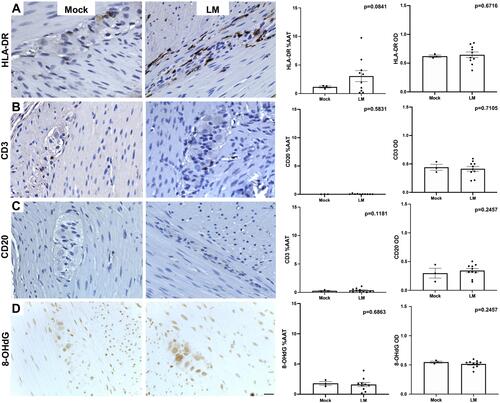
Figure 3 Images of proximal colon of cynomolgus macaques treated with mock (MO2) or LM (LM9) inoculations immunostained against pan-neuronal maker PGP9.5 (A), α-syn (B), p-α –syn (C, black arrows) and their %AAT expression and OD expression (mean ± SEM). Lewy body in human PD brain (D, black arrowhead). Scale bar = 25µm for all panels.
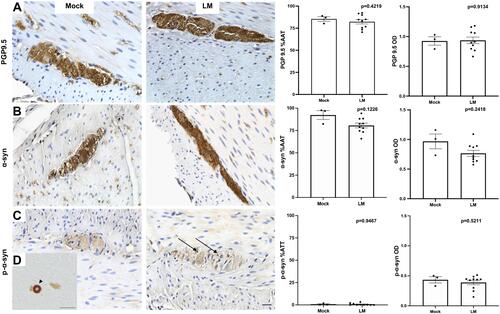
Figure 4 Double immunofluorescence images of proximal colon showing α-syn colocalization with pan-neuronal marker PGP9.5 in myenteric ganglia of no-colitis control (MO2) and colitis (LM9) cynomolgus macaques. Scale bar = 50µm for all panels.
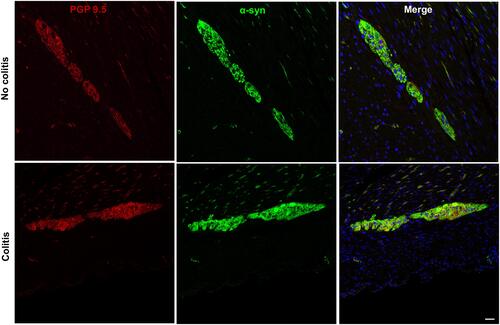
Figure 5 Pearson correlations graphs comparing colitis score vs α-syn optical density (A), HLA-DR %AAT vs α-syn OD (B), colitis score vs α-syn %AAT (C), and HLA-DR %AAT vs α-syn %AAT (D). Each point represents average per subject; the blue points correspond to Mock- and red points to LM- inoculated subjects.
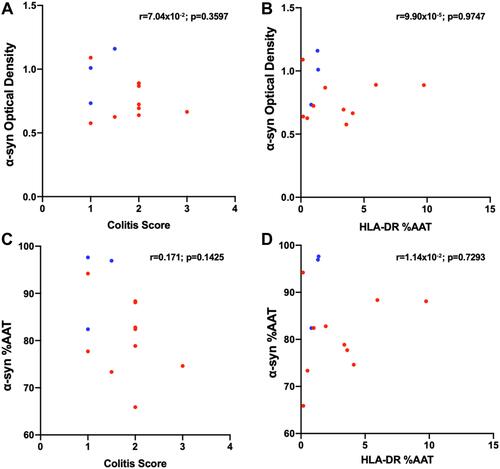
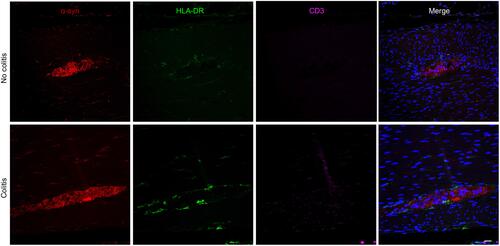
Figure 6 Triple immunofluorescence images of proximal colon sections showing α -syn-ir, HLA-DR-ir and CD3-ir in myenteric ganglia of no-colitis (MO2) and colitis (LM1) subjects. Scale bar = 50µm for all panels.