
Figures & data
Table 1 Clinical and Laboratory Characteristics of the Controls, Incidentaloma, Pheochromocytoma, and Cushing’s/Conn’s Adenoma Patients. Results are Presented as Median with 25% and 75% Percentiles
Figure 1 Violin plots of plasma total NO (A), ONOO− (B), S-nitrosothiols (C) and nitrotyrosine (D) of the control, incidentaloma, pheochromocytoma and Cushing’s Conn’s adenoma patients. Results are presented as median with 25% and 75% percentiles. **p<0.01, ***p<0.001, ****p<0.0001 indicate significant differences from the controls; ~p<0.05, ~~p<0.01, ~~~p<0.001 indicate significant differences from the Cushing’s Conn’s adenoma group; total nitric oxide (NO), peroxynitrite (ONOO−).
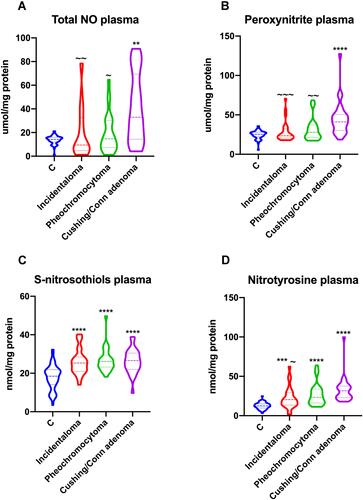
Figure 2 Violin plots of serum MPO (A), plasma IL-1β (B), TNF-α (C) and HIF-1α (D) of the control, incidentaloma, pheochromocytoma and Cushing’s Conn’s adenoma patients. Results are presented as median with 25% and 75% percentiles. **p<0.01, ***p<0.001, ****p<0.0001 indicate significant differences from the controls; myeloperoxidase (MPO), interleukin 1 beta (IL-1β) and tumor necrosis factor α (TNF-α).
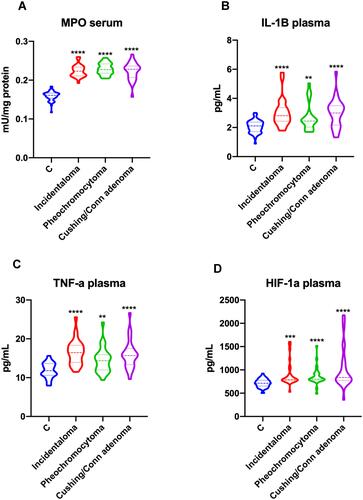
Figure 3 Correlation heat map between the analyzed nitrosative stress, inflammation and clinical parameters in serum and plasma of the patients with adrenal masses; body mass index (BMI), C reactive protein (CRP), nitric oxide (NO), myeloperoxidase (MPO), interleukin 1 beta (IL-1β), tumor necrosis factor α (TNF-α) and hypoxia-inducible factor 1 alpha (HIF-1α).
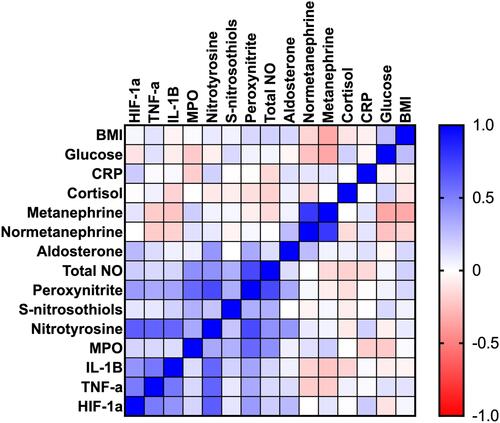
Table 2 Multifactorial Regression Analysis of Nitrosative Stress and Inflammatory Biomarkers in Adrenal Tumor Patients
Table 3 Area Under the Curve of Nitrosative Stress and Inflammatory Biomarkers Between Adrenal Tumor Patients and the Controls