Figures & data
Figure 1 Flowchart of this work.
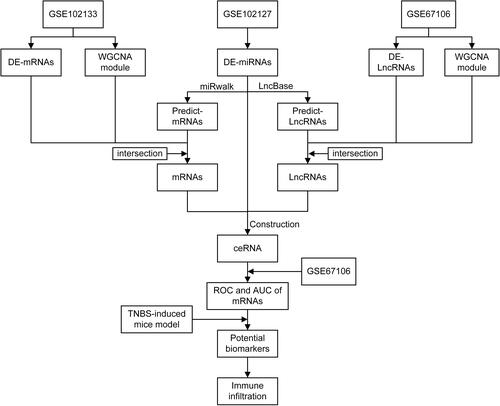
Table 1 The Sequences of Primers
Figure 2 DEmRNA screening and enrichment analysis. (A) Volcano plot of DEmRNA. (B) Top 10 GO enrichment. (C) Top 10 KEGG enrichment. (D) KEGG chord plot of top 10 terms.
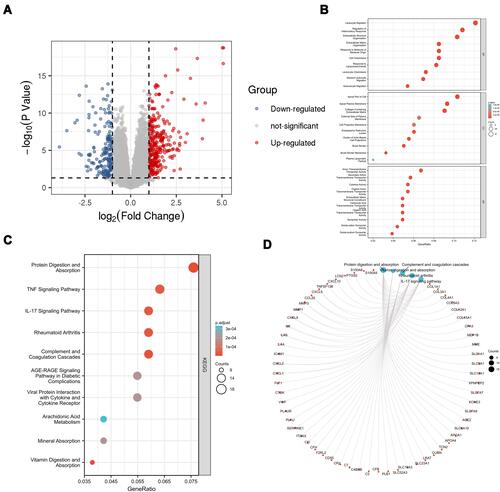
Table 2 The DEmiRNAs
Figure 3 mRNA modules analyzed by WGCNA. (A) Determination of soft-thresholding power. (B) Clustering dendrogram. (C) The module-trait relationships.
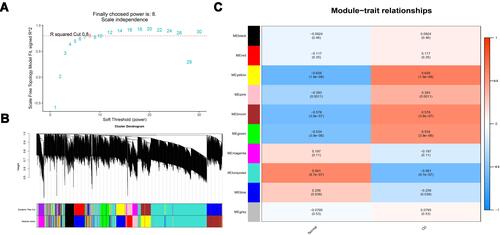
Figure 4 Identification of candidate overlapping mRNA. (A) Intersection of DEmRNAs, WGCNA modules, and miRwalk-predict. (B) Heatmap of overlapping mRNA.
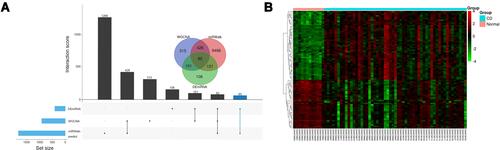
Figure 5 The overlapping mRNA function annotation. (A) PPI network. (B) hub gene identified via cytohubba. (C) KEGG enrichment. (D) GO enrichment. (E) GO chord plot of top 10 term. (F) KEGG chord plot of top 10 term. Lollipop chart.
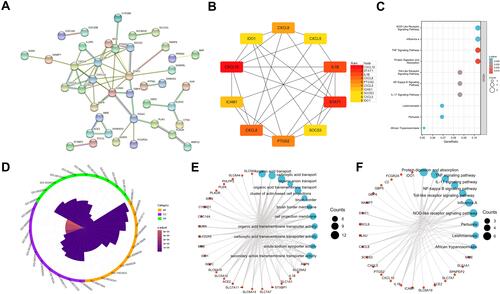
Table 3 The DElncRNAs
Figure 6 DElncRNA screening. (A) Volcano plot of DElncRNA. (B) Determination of soft-thresholding power. (C) Clustering dendrogram. (D) The module-trait relationships. (E) Intersection of DElncRNA, WGCNA, and LncBase-predict.
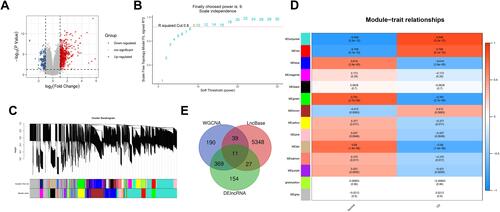
Figure 7 The construction of (A) ceRNA network, red color represents upregulate and blue represents downregulate, circle shape represents mRNAs, triangle represents miRNAs, and rhombus represents lncRNAs. (B) Sankey diagram of final ceRNA network.
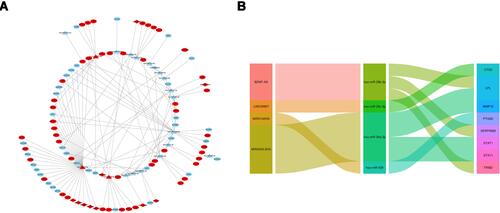
Figure 8 Validation and immune infiltration analysis. (A) and (B) ROC of mRNAs in the ceRNA network. (C) The differential of immune infiltration between CD and normal controls. (D) Correlation matrix of immune cell proportions and PTGS2. (E) Lollipop chart of correlation between immune cell and PTGS2. *p<0.05, **p<0.01, ***p<0.001.
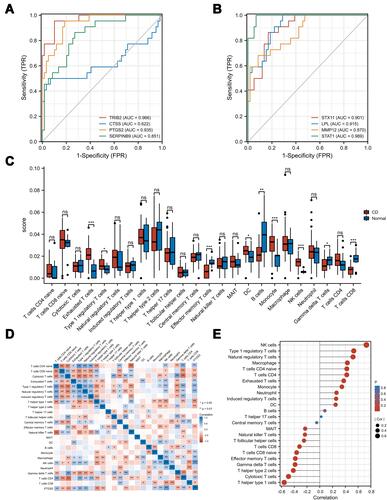
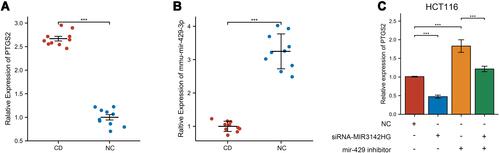
Figure 9 The relative expression validated via qRT-PCR. (A) The relative expression of PTGS2 in TNBS-induced mice and control mice. (B) The relative expression of mmu-mir-429 in TNBS-induced mice and control mice. (C) The relative expression of PTGS2 in HCT116 cells transfected with NC, si-MIR3142HG, and mir-429 inhibitor. ***p<0.001.